Module 12: Statistics
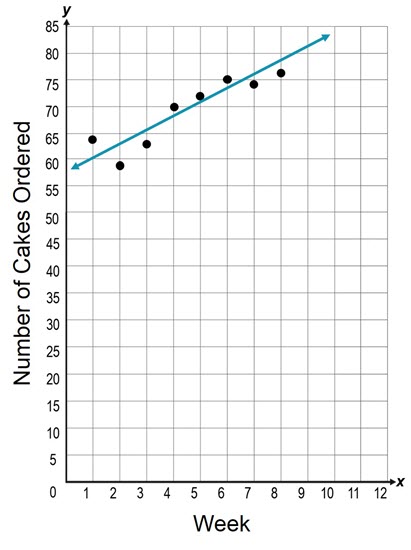
This scatterplot shows the number of cakes ordered at local bakery.
In mathematics, statistics refers to the collection and study of large groups of numerical data. By analyzing data, you can determine if patterns exist and if relationships are present. In this module, you will learn how to use the curve that best fits a data set to solve practical problems and to make predictions.
Getting Started
![]()
 How would you describe the relationship between the variables? For each scatterplot, describe the relationship between the x- and y-values. Click the player button to get started.
Key Vocabulary
![]()
To view the definitions for these key vocabulary terms, visit the course glossary.
correlation
curve of best fit
data set
element
line of best fit
linear function
linear model
quadratic function