|
Module 12 Overview: Trigonometric Graphs and Identities
 Sit still, and take a few deep breaths. Then relax, and pay attention to your breathing pattern. Sit still, and take a few deep breaths. Then relax, and pay attention to your breathing pattern.
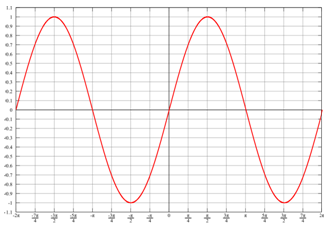
Breathing has a rhythmic pattern, with alternating periods of inhaling and exhaling. As you inhale, the volume of oxygen in your lungs increases, and then decreases as you exhale. At rest, a complete cycle (one inhale followed immediately by one exhale) takes approximately five seconds on average.
You can analyze the air flow rate during the periodic rhythm of breathing through the graph of a sine function, where air flow rate is a function of the sine of time. The following graph depicts this breathing pattern.
In this module, you will learn to use the graphs of trigonometric functions to investigate periodic behavior in the world around us. In addition, you will learn how to use certain identities to simplify trigonometric expressions and solve trigonometric equations.
|
