|
Introduction to Topic 2.2: Linear Regression
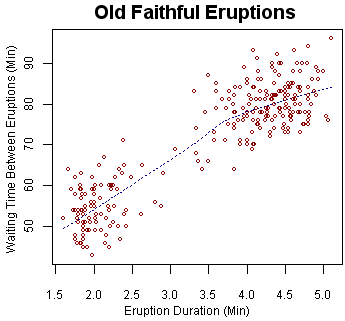
In this topic, you will collect and analyze data; investigate scatterplots to determine if patterns exist and then identify the patterns; find an equation for the linear function of best fit, and graph linear functions; and make predictions, using data, scatterplots, or the equations for the line of best fit for real-world events. The following image is a scatterplot showing the eruptions of Old Faithful. You can use this to make a linear regression to predict its behavior.
Essential Questions:
How do you find the equations for a linear function for the curve of best fit for data, using a graphing calculator?
How can you use the linear equation for the curve of best fit to predict future results of the data?
|
