Module 3: Modern Atomic Theory, Electron Structure, and Periodicity

![]()
![]() Before you begin this assignment, make sure to download the Models of the Hydrogen Atom Scientific Investigation Report. As you complete this scientific investigation, fill in any needed information on the report template. If you need more information about each section of the report, please visit the Developmental Module.
Before you begin this assignment, make sure to download the Models of the Hydrogen Atom Scientific Investigation Report. As you complete this scientific investigation, fill in any needed information on the report template. If you need more information about each section of the report, please visit the Developmental Module.
This scientific investigation is available below or in a printable version. Make sure to complete both Part I and Part II of the scientific investigation.
Introduction
During the first part of the 20th century, many chemists devoted their pursuits to discovering the structure and behavior of atoms. Without actually traveling back in time, there is now way to see exactly what they saw; however, using simulations, like the one in this activity, students of chemistry can replicate their experiments. In this assignment, you will first observe a simulated light spectrum of hydrogen gas. Then, you will look at spectra predicted by different models of the atom.
The models you will test include:
- John Dalton's Billiard Ball model
- J.J. Thomson's Plum Pudding model
- Ernest Rutherford's Classical Solar System model
- Niels Bohr's Shell model
- Louis de Broglie's Electron Wave model
- Erwin Schrödinger's Quantum Mechanical model
Objectives
In this scientific investigation, you will:
- explore the electromagnetic spectrum produced by the element hydrogen;
- examine the various atomic models proposed by 20th century scientists; and
- make predictions based on a model.
Hypothesis
Using the Procedure and Data Collection section below, read through the procedural information for this scientific investigation. Based on your understanding of the procedure, develop your own hypotheses which describe your expected results. Specifically, how do you think the spectrum produced by hydrogen will change based on the model? Record these hypotheses in the Hypothesis section of your Models of the Hydrogen Atom Scientific Investigation Report.
Required Simulation
Models of the Hydrogen Atom Simulation
(click on image below to access simulation)
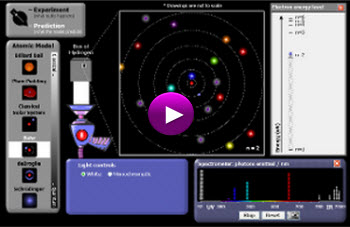
Provided by: PhET Interactive Simulations
University of Colorado
http://phet.colorado.edu
*You will also need a stopwatch or a watch with a second hand to complete this assignment.
Procedure and Data Collection
Part I: Experiment
- In the Light Controls area, make sure that White light is selected. Click the button on the light "gun" to start the flow of light. You should see a white light shining into a box containing hydrogen gas molecules. What is going on in the small box is reflected in the larger box with the question mark. In the Data section of your Models of the Hydrogen Atom Scientific Investigation Report, explain why the light photons passing up through the box have different colors, though the light being used is white.
- Next, place a check in the Show Spectrometer check box. Notice that the color of the photons passing up through the box corresponds to a wavelength of UV, visible, or IR radiation.
- In the Light Controls area, turn on the Monochromatic light. Notice that the incoming photons are now all the same color. A spectrum slider appears that allows you to change the energy of the incoming photons. Move the slider across the spectrum from ultraviolet (UV) down to the infra-red (IR). Notice the color of the lamp and the photons moving up the screen. Decide how you can distinguish between UV and IR photons. In the Data section of your Models of the Hydrogen Atom Scientific Investigation Report, record how you can distinguish between the two types of electromagnetic radiation.
- Pause the simulation. In the Light Controls area, turn on the White light again. Move the Slow→Fast slider all the way to Slow. Start the simulation again.
- Watch the photons carefully for a few minutes. Most of the photons pass through the box of hydrogen unaffected. Occasionally, a photon is absorbed by something in the question mark box and a new photon of the same energy (color) leaves the box. In the Data section of your Models of the Hydrogen Atom Scientific Investigation Report, describe what is going on in the question mark box based on what you learned in this module.
- Pause the simulation. Move the Slow→Fast slider all the way to Fast and click Reset on the Spectrometer. Start the simulation and let it run for exactly one minute.
- After one minute, pause the simulation and click on the camera icon in the Spectrometer window to take a snapshot of the experiment. In the Data section of your Models of the Hydrogen Atom Scientific Investigation Report, describe what is happening in the snapshot. Specifically, describe the colors, estimated wavelengths, and relative numbers of stacked colored balls. These colored balls correspond to photons emitted by the question mark box.
- Slide the snapshot off to the right side of the screen for later comparison with the models in the Prediction section below.
- Click the red check box to hide the Spectrometer. Your Experiment snapshot will disappear, but it will come back when you open the Spectrometer again.
Part II: Prediction
John Dalton's Billiard Ball Model
![]() John Dalton proposed that an atom was simply a very tiny hard ball. He thought that atoms were the smallest building blocks of matter and that they could not be subdivided, created, or destroyed into smaller particles. He also believed that all atoms of a given element were identical.
John Dalton proposed that an atom was simply a very tiny hard ball. He thought that atoms were the smallest building blocks of matter and that they could not be subdivided, created, or destroyed into smaller particles. He also believed that all atoms of a given element were identical.
- In the upper left corner, switch the control from Experiment to Prediction. Click on Billiard Ball under Atomic Model. Make sure the Light Control is set to White.
- Move the Slow→Fast slider all the way to Slow. Start the simulation and watch what is happening for about a minute. In the Data section of your Models of the Hydrogen Atom Scientific Investigation Report, describe what is happening. Include a sketch what you think the spectrum will look like for Dalton’s model. Pause the simulation.
- Click the check box to open the Spectrometer. Move the Slow→Fast slider all the way to Fast and click Reset on the Spectrometer. Begin the simulation and let it run for exactly one minute.
- After one minute, pause the simulation and click on the camera icon in the Spectrometer window to take a snapshot of the experiment. In the Data section of your Models of the Hydrogen Atom Scientific Investigation Report, compare what is happening in Snapshot 1: Experiment to Snapshot 2: Billiard Ball. Specifically, does the spectrum for the Billiard Ball model match that of the experimental (real) hydrogen spectrum? If not, how is it different?
- Click the red check box to close the snapshot associated with the Billiard Ball Model, but retain the Experimental snapshot.
J.J. Thomson's Plum Pudding Model
![]() J.J. Thomson is credited with the discovery of a negatively-charged subatomic particle, now known as the electron. His model of the atom became known as the “plum pudding” model named after the British treacle dessert in which dried fruit is cooked into a heavy steamed pudding. In Thomson’s model, negative particles were arranged in the atom like the fruit in a plum pudding.
J.J. Thomson is credited with the discovery of a negatively-charged subatomic particle, now known as the electron. His model of the atom became known as the “plum pudding” model named after the British treacle dessert in which dried fruit is cooked into a heavy steamed pudding. In Thomson’s model, negative particles were arranged in the atom like the fruit in a plum pudding.
- Click on Plum Pudding under Atomic Model. Make sure the Light Control is set to White. Click on the check box to close the Spectrometer. Your Experiment snapshot will disappear, but it will come back when you open the Spectrometer again
- Move the Slow→Fast slider all the way to Slow. Start the simulation and watch what is happening for about a minute. In the Data section of your Models of the Hydrogen Atom Scientific Investigation Report, describe what is happening. Include a sketch what you think the spectrum will look like for Thomson’s model. Pause the simulation.
- Click the check box to open the Spectrometer. Move the Slow→Fast slider all the way to Fast and click Reset on the Spectrometer. Begin the simulation and let it run for exactly one minute.
- After one minute, pause the simulation and click on the camera icon in the Spectrometer window to take a snapshot of the experiment. In the Data section of your Models of the Hydrogen Atom Scientific Investigation Report, compare what is happening in Snapshot 1: Experiment to Snapshot 3: Plum Pudding. Specifically, does the spectrum for the Plum Pudding model match that of the experimental (real) hydrogen spectrum? If not, how is it different?
- Click the check box to close the snapshot associated with the Plum Pudding Model, but retain the Experimental snapshot.
Ernest Rutherford's Classical Solar System Model
![]() Ernest Rutherford began studying radioactivity and discovered two important emissions from radioactive atoms. He named them alpha and beta rays. The discovery of these particles led to his famous “Gold Foil Experiment”. Rutherford’s Gold Foil Experiment proved two very important things about the atom: the atom is mostly empty space and the atom has a very small and dense positively charged center, which is now known to be the nucleus.
Ernest Rutherford began studying radioactivity and discovered two important emissions from radioactive atoms. He named them alpha and beta rays. The discovery of these particles led to his famous “Gold Foil Experiment”. Rutherford’s Gold Foil Experiment proved two very important things about the atom: the atom is mostly empty space and the atom has a very small and dense positively charged center, which is now known to be the nucleus.
- Click on Classical Solar System under Atomic Model. Make sure the Light Control is set to White. Click on the check box to close the Spectrometer. Your Experiment snapshot will disappear, but it will come back when you open the Spectrometer again
- Move the Slow→Fast slider all the way to Slow and start the simulation. In the Data section of your Models of the Hydrogen Atom Scientific Investigation Report, describe what is happening. Include a sketch what you think the spectrum will look like for Rutherford’s model. Pause the simulation.
- Click the check box to open the Spectrometer. Move the Slow→Fast slider all the way to Fast and click Reset on the Spectrometer. Begin the simulation and let it run for exactly one minute.
- After one minute, pause the simulation and click on the camera icon in the Spectrometer window to take a snapshot of the experiment. In the Data section of your Models of the Hydrogen Atom Scientific Investigation Report, compare what is happening in Snapshot 1: Experiment to Snapshot 4: Classical Solar System. Specifically, does the spectrum for the Classical Solar System model match that of the experimental (real) hydrogen spectrum? If not, how is it different?
- Click the check box to close the snapshot associated with the Classical Solar System Model, but retain the Experimental snapshot.
Niels Bohr's Model
![]() Niels Bohr is responsible for revising Rutherford's model of the atom. He believed that the electrons could not be found just anywhere outside of the nucleus. Instead, Bohr explained that the electrons were found at specific distances from the nucleus in what he called energy levels. He asserted that electrons can exist only at those certain energy levels (also called shells), and not at any energy levels between them.
Niels Bohr is responsible for revising Rutherford's model of the atom. He believed that the electrons could not be found just anywhere outside of the nucleus. Instead, Bohr explained that the electrons were found at specific distances from the nucleus in what he called energy levels. He asserted that electrons can exist only at those certain energy levels (also called shells), and not at any energy levels between them.
- Click on Bohr under Atomic Model. Make sure the Light Control is set to White. Click on the check box to close the Spectrometer. Your Experiment snapshot will disappear, but it will come back when you open the Spectrometer again. Click the check box to Show electron energy level diagram.
- Move the Slow→Fast slider all the way to Slow and start the simulation. In the Data section of your Models of the Hydrogen Atom Scientific Investigation Report:
- describe what you see in the atom diagram;
- describe what you see in the energy level diagram; and
- describe how the atom diagram and energy level diagrams are related.
- Pause the simulation. Click the check box to open the Spectrometer. Move the Slow→Fast slider all the way to Fast and click Reset on the Spectrometer. Begin the simulation and let it run for exactly one minute.
- After one minute, pause the simulation and click on the camera icon in the Spectrometer window to take a snapshot of the experiment. In the Data section of your Models of the Hydrogen Atom Scientific Investigation Report, compare what is happening in Snapshot 1: Experiment to Snapshot 5: Bohr. Specifically, does the spectrum for the Bohr model match that of the experimental (real) hydrogen spectrum? If not, how is it different?
- Slide the Bohr snapshot and the Experiment snapshot off to the right for later comparisons.
Shells in this energy diagram go from 1 to 6. An increase in energy level (say from 1 to 6) can only occur if a photon of incoming light is absorbed. A decrease in energy level (say from 2 to 1) is accompanied by the emission of a photon as the excited electron releases its excess energy. In the Help menu, select Transitions to see all possible transitions.
- Move the Slow→Fast slider all the way to Slow.
- In the Light Controls area, turn on the Monochromatic light.
- Set the monochromatic light source to 122 nanometers by clicking on the value box and typing in “122.” Start the simulation. This provides photons of just the right energy to move the electron from the n=1 to the n=2 shell. In the Data section of your Models of the Hydrogen Atom Scientific Investigation Report, describe the atom diagram and the energy level diagram. The electron decays are colored - what is the meaning of the colors?
- Now, set the light source to 103 nm. This provides photons of just the right energy to move the electron from the n=1 to the n=3 shell. In the Data section of your Models of the Hydrogen Atom Scientific Investigation Report, describe the atom diagram and the energy level diagram. How do the transitions differ from n=1 to n=2?
- Set the light control to White and pause the simulation.
Louis de Broglie's Model
![]() By incorporating the ideas of Max Planck and Albert Einstein, Louis de Broglie believed that electrons can be both waves and particles. He stated that any moving particle or object had an associated wave, in what is known as the wave-particle duality. His work led to the development of electron microscopes.
By incorporating the ideas of Max Planck and Albert Einstein, Louis de Broglie believed that electrons can be both waves and particles. He stated that any moving particle or object had an associated wave, in what is known as the wave-particle duality. His work led to the development of electron microscopes.
- Click on de Broglie under Atomic Model. Make sure the Light Control is set to White. Click on the check box to close the Spectrometer. Your Experiment snapshot and Bohr snapshot will disappear, but they will come back when you open the Spectrometer again.
- Make sure that Show electron energy level diagram is clicked. In the Data section of your Models of the Hydrogen Atom Scientific Investigation Report, describe the similarities and differences in appearance between the de Broglie and Bohr models of the hydrogen atom.
- Click the check box to open the Spectrometer. Move the Slow→Fast slider all the way to Fast and click Reset on the Spectrometer. Begin the simulation and let it run for exactly one minute.
- After one minute, pause the simulation and click on the camera icon in the Spectrometer window to take a snapshot of the experiment. In the Data section of your Models of the Hydrogen Atom Scientific Investigation Report, compare what is happening in Snapshot 1: Experiment to Snapshot 6: de Broglie. Specifically, does the spectrum for the de Broglie model match that of the experimental (real) hydrogen spectrum? If not, how is it different?
- In the top left corner of the atomic view, change the radial view to 3-D view. In the Data section of your Models of the Hydrogen Atom Scientific Investigation Report, describe what you see.
- Slide the de Broglie snapshot, the Bohr snapshot, and the Experiment snapshot off to the right for later comparisons.
Erwin Schrödinger's Model
![]() Like de Broglie, Erwin Schrödinger sought to explain the movement of an electron in an atom as a wave. In addition, he used advanced mathematics to predict the likelihood of finding an atom in a specific location.
Like de Broglie, Erwin Schrödinger sought to explain the movement of an electron in an atom as a wave. In addition, he used advanced mathematics to predict the likelihood of finding an atom in a specific location.
- Click on Schrödinger under Atomic Model. Make sure the Light Control is set to White. Click on the check box to close the Spectrometer. Your Experiment snapshot, the Bohr snapshot, and the de Broglie snapshot will disappear, but they will come back when you open the Spectrometer again.
- Make sure that Show electron energy level diagram is clicked. In the Data section of your Models of the Hydrogen Atom Scientific Investigation Report, describe the similarities and differences in appearance between the de Broglie and Bohr models of the hydrogen atom.
- Click the check box to open the Spectrometer. Move the Slow→Fast slider all the way to Fast and click Reset on the Spectrometer. Begin the simulation and let it run for exactly one minute.
- After one minute, pause the simulation and click on the camera icon in the Spectrometer window to take a snapshot of the experiment. In the Data section of your Models of the Hydrogen Atom Scientific Investigation Report, compare what is happening in Snapshot 1: Experiment to Snapshot 7: Schrödinger. Specifically, does the spectrum for the Schrödinger model match that of the experimental (real) hydrogen spectrum? If not, how is it different?
Spread the Experimental snapshot, as well as the Bohr, de Broglie, and Schrödinger model snapshots across simulation screen. Take a screenshot of these four snapshots. Paste the screenshot into the Data section of your Models of the Hydrogen Atom Scientific Investigation Report.
Data
Using the Data section of the Models of the Hydrogen Atom Scientific Investigation Report, make sure to complete all requested data on the report itself.
Data Analysis
In the Data Analysis section of your Models of the Hydrogen Atom Scientific Investigation Report, provide responses to the following questions:
- In four to five sentences, explain the evolution of the model of the atom, starting with John Dalton's Billiard Ball Model and ending with Schrödinger's model.
- In which ways are the de Broglie and Schrödinger models similar? How are they different?
- Why do you think this simulation uses a hydrogen atom instead of another type of atom? What would be different if you performed the same scientific investigation, but used a different atom?
Conclusion
Using the Conclusion section of your Models of the Hydrogen Atom Scientific Investigation Report, compose three to four sentences describing an overall conclusion about the relationships between all of the models that you examined in this scientific investigation. Were your hypotheses true or false, and how do you know? Use the data and notes that you collected from your simulation experience to form your conclusion. Make sure that you include information that you gained from data analysis to support your conclusion.
Experimental Sources of Error
On your Models of the Hydrogen Atom Scientific Investigation Report, provide responses to the following questions: Are there any sources of error? If so, what are they, and what could be done to minimize error?
![]()
Once you have completed your scientific investigation, please submit your work to the dropbox.
![]()
Once you have completed this module, please complete the module test.