Cultural Regions
Mapping the Earth
Cartography, or the practice of making maps, involves science, art, and technical skill. To a casual observer, information contained in a map may seem straightforward. However, maps are continually changing over time. For instance, take a moment to study this map from 1491. It was developed one year before Christopher Columbus’ first voyage. Why do you think the map shows Africa, Asia, and Europe, but not North and South America?
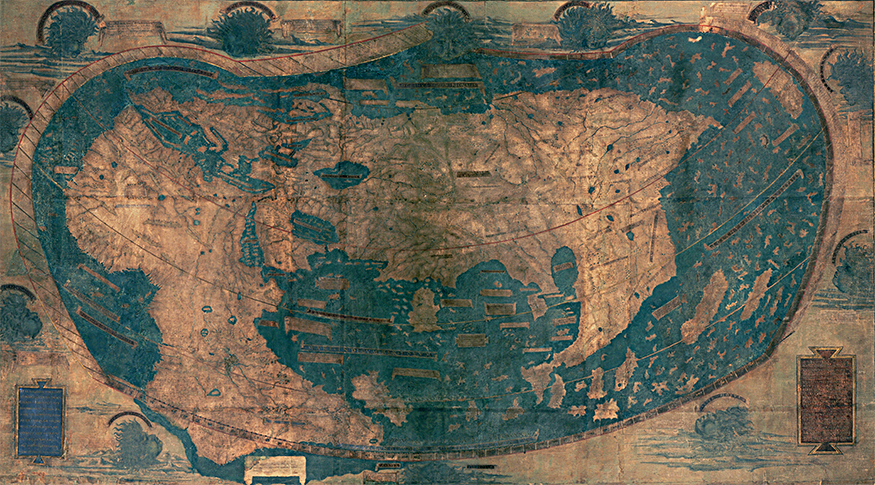
Martellus Map, 1491
The map above depicts European knowledge of the world during the fifteenth century. Cartography has advanced tremendously over the last five hundred years. New technologies continue to enhance people's ability to map the planet. They have changed the way humans see the world.
To demonstrate how different perspectives influence ways individuals see the world, take a moment to examine the maps below. All three maps are accurate. Each one, however, is commonly found in a different cultural region. On which continents might you find each of these maps?
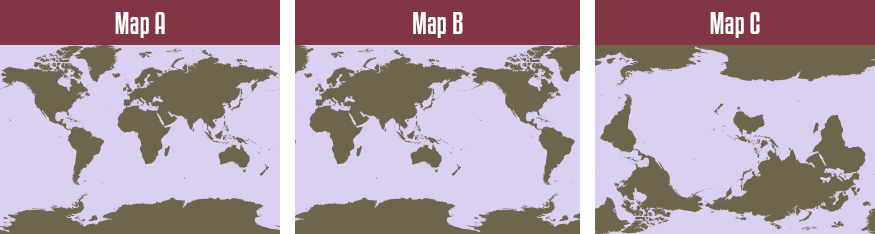
Comparison of Maps A, B, and C: Detailed Descriptions
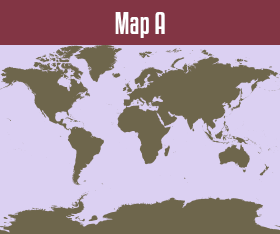
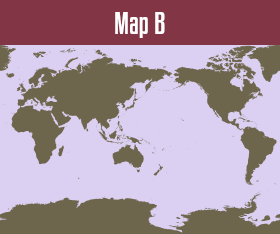
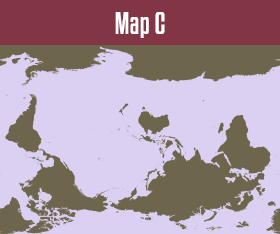
The Atlantic Ocean is central to Map A. Most Europeans and Americans have this perspective of the world. The Pacific Ocean is the focal point of Map B. This is how Asian countries typically view the world. Finally, the South Pole is at the top of Map C. Australians and others who live in the Southern Hemisphere generally use a map like this as a novelty or political statement.
Cultural Influence on Place Names

Different maps sometimes inconsistently name the same region or geographic feature. This variability depends on where a map is made. It is often due to cultural or political differences. In this interactivity, you will learn about cultural influence on place names. Click the player to begin.
View a printable version of this interactivity or an ADA compliant transcript.