Human Migration
Human Migration Infographic
Economic, environmental, political, and social factors influence human migration that occurs today. For this reason, news reports often focus on human migration.
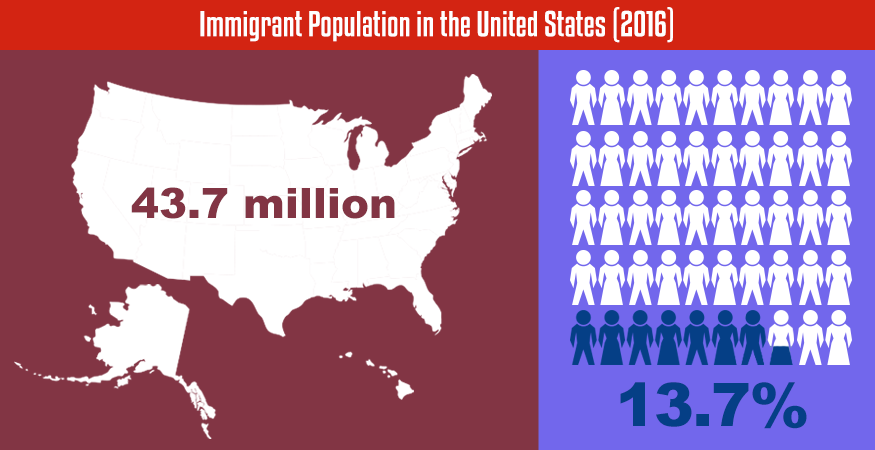
For this assignment, you will create an information graphic that explains push and pull factors that cause people to migrate. Another name for an information graphic is an infographic. These graphics convey pieces of information using visual representations. For example, the infographic below illustrates the 2016 immigrant population in the United States.

Immigrant Population in the United States: Detailed Description
You should find at least four examples of current human migration within the last five years. For each example, determine the following:
- where people were migrating from;
- where they were migrating to;
- what reasons they had for migrating; and
- whether those reasons represent push or pull factors.
You may associate multiple factors with a single example. For instance, people may have fled their homes because of a civil war and moved to a country with arable land to farm. In this case, you can associate a push and pull factor with the migration. Once you have gathered your data, incorporate it into an infographic that is well-organized, interesting, and visually appealing.
