International Trade
Resources are not equally distributed among nations of the world. In fact, no country has all the resources necessary for survival and economic growth. In modern times, this situation has led to the development of a global economy comprised of interdependent nations. In this topic, you will examine different factors that influence international trade. You will also learn how these international relationships developed over time, and impact global economic growth.
Essential Questions
- What factors influence the distribution of trade and other economic activities?
- How do economic unions impact global economic growth?
- How have economic interactions changed over time?
Warm-Up
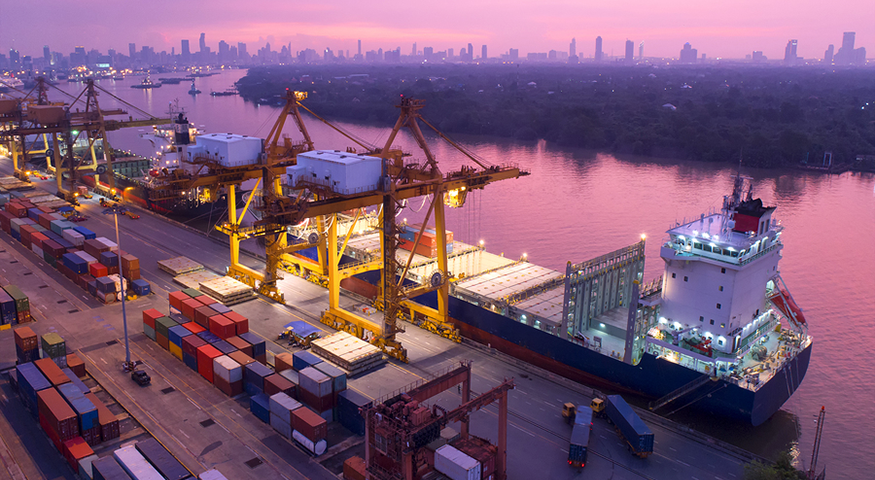
![]() Take a moment to consider some of the items you interact with or use on a daily basis. This might include your food, clothes, electronics, or family's car. Do you know where these items were made? If possible, check the label or packaging to see where. Why do you think each item was produced in that particular country? Do you see the same country names repeated over and over?
Take a moment to consider some of the items you interact with or use on a daily basis. This might include your food, clothes, electronics, or family's car. Do you know where these items were made? If possible, check the label or packaging to see where. Why do you think each item was produced in that particular country? Do you see the same country names repeated over and over?
The table below is based on data from the United States Census Bureau. It shows the top ten trading partners of the United States in 2017. Did any of these countries produce the personal items you inspected? If so, which ones?
| Rank | Country | Total Trade (in billions) |
Percentage of Total U.S. Trade |
|---|---|---|---|
| 1 | China | $636 | 16.4% |
| 2 | Canada | $582.4 | 15% |
| 3 | Mexico | $557 | 14.3% |
| 4 | Japan | $204.2 | 5.3% |
| 5 | Germany | $171.2 | 4.4% |
| 6 | South Korea | $119.4 | 3.1% |
| 7 | United Kingdom | $109.4 | 2.8% |
| 8 | France | $82.5 | 2.1% |
| 9 | India | $74.3 | 1.9% |
| 10 | Italy | $68.3 | 1.8% |
| Rank | Country | Total Trade (billions) |
% of Total U.S. Trade |
|---|---|---|---|
| 1 | China | $636 | 16.4% |
| 2 | Canada | $582.4 | 15% |
| 3 | Mexico | $557 | 14.3% |
| 4 | Japan | $204.2 | 5.3% |
| 5 | Germany | $171.2 | 4.4% |
| 6 | S. Korea | 119.4 | 3.1% |
| 7 | U.K. | $109.4 | 2.8% |
| 8 | France | $82.5 | 2.1% |
| 9 | India | $74.3 | 1.9% |
| 10 | Italy | $68.3 | 1.8% |