Writing and Graphing a Direct Variation Equation
Writing Direct Variation Equations
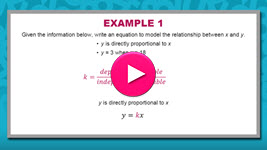 A direct variation equation is a linear equation written in the form, y = kx, where k represents the constant of proportionality. In this interactivity, you will learn how to write direct variation equations and how to use them to solve practical problems. Click the player button to begin.
View a printable version of this interactivity.
Alternate Strategy
In the previous interactivity, you were presented one strategy to solve problems involving direct variations. Below is a Self-Check that was included in the interactivity, along with an alternate strategy to determine the solution.
Problem: The amount of money that Kayla saves each week varies directly with the amount of money she earns each week.
Last week, Kayla earned $300 and saved $75.
Next week, if Kayla earns $340, she will save $_____.
Response: When a direct variation exists, the ratios of the dependent variable to the independent variable are equal. Use the given information to determine the ratios and set up a proportion. Then, cross-multiply to find the solution.
the amount of money Kayla saved last weekthe amount of money Kayla earned last week |
= | the amount of money Kayla saved next weekthe amount of money Kayla earns next week |
| 30075 | = | 340x |
| 300 · x | = | 75 · 340 | Cross-multiply |
| 300x | = | 25500 | Simplify |
| x | = | 85 | Divide both sides by 300 |
So, if Kayla earns $340, then she will save $85.
How to Identify a Direct Variation Equation
Problem: Which equation represents a direct variation?
- x + y = 7
- y x
= 4
Response: Determine which equation can be written in the form y = kx.
- View the solution below.
x + y = 7 −x −x __________________ y = −x + 7
- View the solution below.
x · y x = 4 · x y = 4x
Graphing Direct Variation Equations
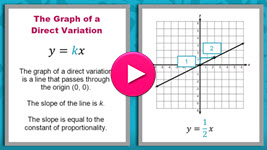 The graph of a direct variation equation is a line that passes through the origin. The slope of the line is k, the constant of proportionality. In this interactivity, you will learn how to use the graph of a direct variation to identify elements included in the direct variation. Click the player button to begin.
View a printable version of this interactivity.
Writing and Graphing a Direct Variation Equation Review
![]()
 Now that you have learned how to write and graph a direct variation equation, it is time to test your knowledge. This interactivity will help you review the information covered throughout this topic. Click the player button to get started.
![]() Did you answer the content review questions incorrectly? Do you want more instruction or extra practice? If so, view the video Representing a Direct Variation Algebraically and Graphically from eMediaVASM.
Did you answer the content review questions incorrectly? Do you want more instruction or extra practice? If so, view the video Representing a Direct Variation Algebraically and Graphically from eMediaVASM.