Curve of Best Fit
Estimating the Curve of Best Fit
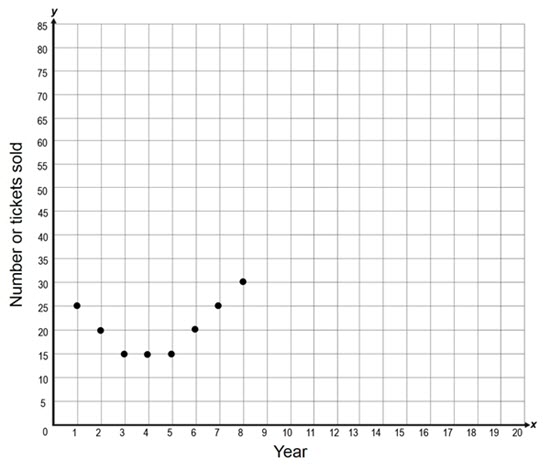
The curve of best fit is the curve that is closest to all of the points. Think back to the scatterplot presented in the Introduction. Which curve best fits the data?
Answer:
Reflecting on the following question will help you estimate the curve of best fit:
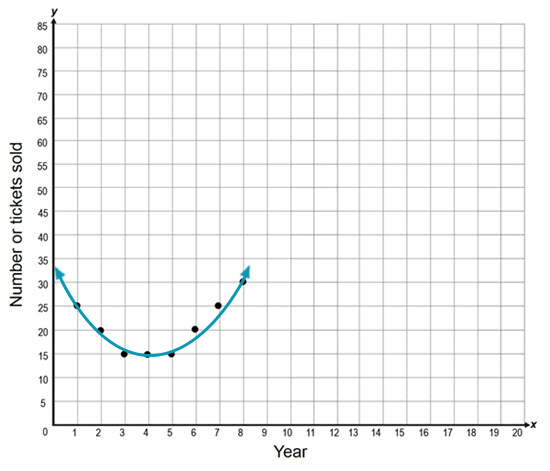
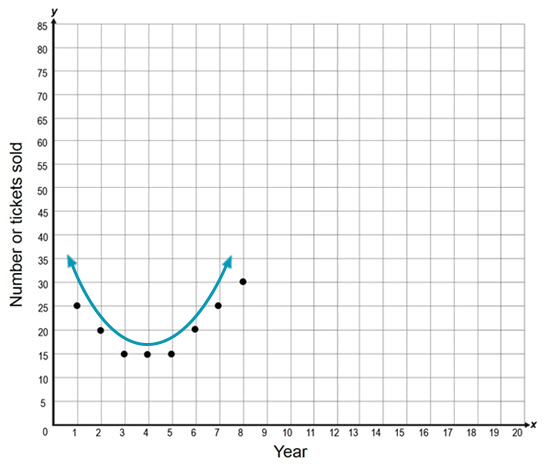
- Which curve is the best fit for the data? Answer Choice A. This curve is closest to all of the points. The curve in Answer Choice B is located above most of the points.
- Which curve would make reasonable predictions? Answer Choice A. This curve is closest to all of the points. So, it can be used to make reasonable predictions about the number of talent show tickets that will be sold in upcoming years.
The line in Answer Choice A is the best fit for the data.
Determining the Equation of the Curve of Best Fit
 The curve of best fit is the curve that is closest to all of the points in a data set. In this interactivity, you will learn how to use the graphing calculator to determine the equation of the curve of best fit. Click the player button to begin.
View a printable version of this interactivity.
Using Mathematical Models of Quadratic Functions to Make Predictions
 In this interactivity, you will explore quadratic models that can be used to represent practical problems. You will also learn how to use the equation of the curve of best fit to make predictions. Click the player button to begin.
View a printable version of this interactivity.
Using a Scatterplot to Determine the Equation of the Curve of Best Fit
Using the graphing calculator to determine the equation of the curve of best fit allows you to make predictions that are more accurate than predictions made using an estimate of the curve of best fit.
Problem: Consider the scatterplot presented in the Warm-Up. Predict the number of talent show tickets that will be sold in the Year 10.
Step 1: Determine the coordinates of each point in the scatterplot.
Step 2: Enter the data into the calculator to generate the equation of the curve of best fit.
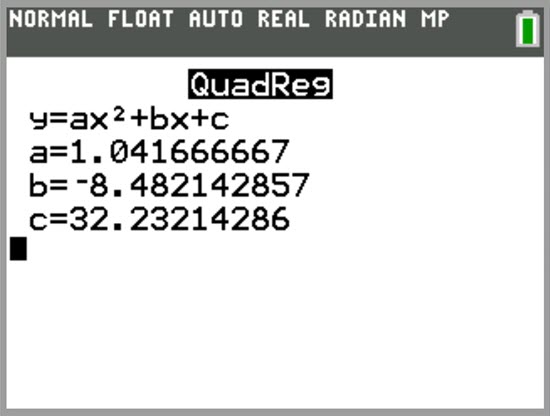
Rounding that occurs in the in-between steps to solving a problem may result in a final answer that is less than accurate. This is why it is important to round to a value that maintains a reasonable number of significant digits. For the problems that you solve in this topic, rounding to the hundredths place is acceptable.
The equation of the curve of best fit for the data is y = 1.04x2 − 8.48x + 32.23.
Step 3: Use the equation to predict the number of talent show tickets that will be sold in Year 10.
Hover your cursor over the image below to view the solution.

Curve of Best Fit Review
![]()
 Now that you have investigated the curve of best fit, it is time to test your knowledge. This interactivity will help you review the information covered throughout this topic. Click the player button to get started.
![]() Did you answer the content review questions incorrectly? Do you want more instruction or extra practice? If so, view the video Determining the Equations of Lines and Curves of Best Fit from eMediaVASM.
Did you answer the content review questions incorrectly? Do you want more instruction or extra practice? If so, view the video Determining the Equations of Lines and Curves of Best Fit from eMediaVASM.