Graphing a Linear Equation Using x- and y-Intercepts
What Are x- and y-Intercepts?
The x-intercept of the graph of a line is the point where the line crosses the x-axis. It can also be described as the value of x when y = 0.
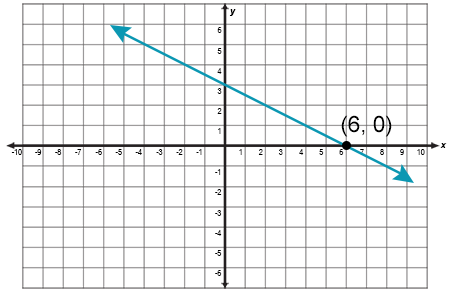
The x-intercept can be given as:
- a value (x = 6), or
- an ordered pair (6, 0).
The y-intercept of the graph of a line is the point where the line crosses the y-axis. It can also be described as the value of y when x = 0.
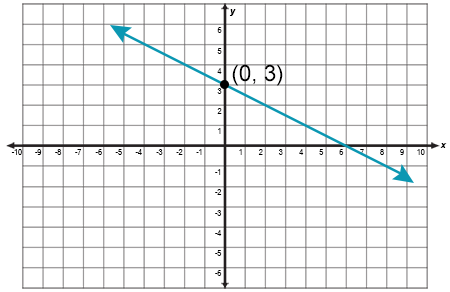
The y-intercept can be given as:
- a value (y = 3), or
- an ordered pair (0, 3).
Practical Problem
In a recent high school basketball game, a team earned 60 points by scoring only two-point and three-point field goals. This situation is modeled by the equation 2x + 3y = 60, where x represents the number of two-point field goals scored and y represents the number of three-point field goals scored.
What information do the x- and y-intercepts in this graph show?
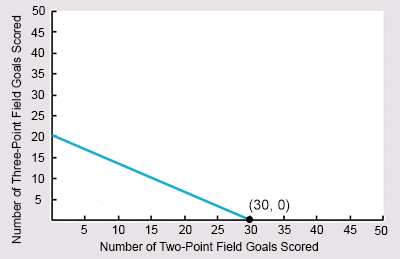
Hover your cursor over the image below to view the correct answer.

Now take a look at this second graph below. What information do the x- and y-intercepts in this graph show?
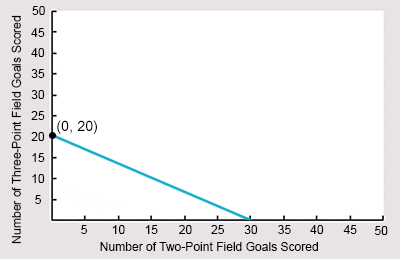
Hover your cursor over the image below to view the correct answer.

Graphing a Linear Equation Using x- and y-Intercepts
 The x-intercept and the y-intercept are two significant points on a line. In this interactivity, you will learn how to graph a line by using these two important points. Click the player button to begin.
View a printable version of this interactivity.
Graphing a Linear Equation Using x- and y-Intercepts Review
![]()
 Now that you have explored graphing a linear equation using x- and y-intercepts, it is time to review your knowledge and practice what you have learned. Click the player button to get started.
![]() Did you answer the content review questions incorrectly? Do you want more instruction or extra practice? If so, view the video Graphing a Line When Given Its Equation in Standard Form from eMediaVASM.
Did you answer the content review questions incorrectly? Do you want more instruction or extra practice? If so, view the video Graphing a Line When Given Its Equation in Standard Form from eMediaVASM.