|
As we learned in the last topic on graphing linear functions, slope is not simply a creation of algebra or geometry: slope is a concept that impacts the real world around us.
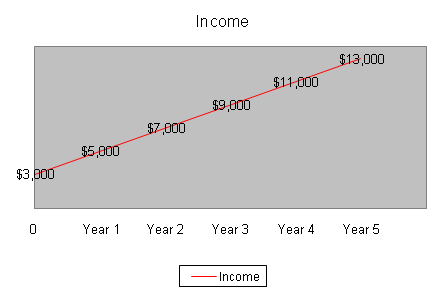
Consider the graph above, representing an annual income of $3,000 during the first year, which increases by $2,000 each year thereafter. This constant rate of change is understood algebraically as slope, and the relationship of the data establishes a linear function (y = 2000x +1000), with x being the number of full years of work. Further, assuming the rate of change will remain unchanged, we can predict confidently that after working 10 years (x = 10), the income will be $23,000:

 |
A large cattle rancher desires to gradually reduce the size his herd over the next 15 years. He now has 40,000 steer, and has determined that a reduction in the herd size of 2,000 steer per year would be best.
- Is this a linear function? Why?
- What is the equation of the linear function?
- How many steer will be in the herd at the end of the 7th year?
Click Here to check your solution.
|
|
