
The Hertzsprung-Russell (H-R) Diagram
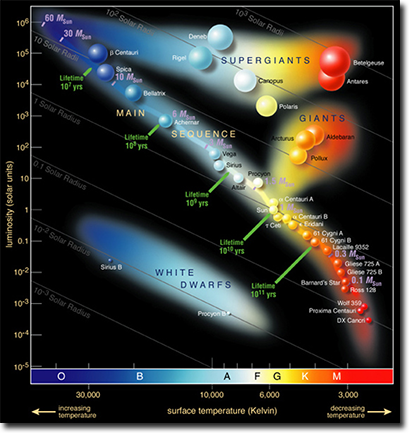
Image courtesy of ESO
The Hertzsprung-Russell diagram is a scatter plot of stars showing the relationships between the stars' absolute magnitudes, luminosity, their spectral types or classifications, and their temperatures. This graph was created in 1910 by Ejnar Hertzsprung and Henry Russell. Both astronomers worked together to create this diagram.
In this topic, you will investigate and interpret the Hertzsprung-Russell Diagram. By doing so, you are going to learn about the evolution of stars. This chart actually is a great way to look at the life of a star. Over time, a stars position on the diagram will change as the properties of the star change.
Essential Questions
- What is the Hertzsprung Russell diagram?
- Where is the Sun located on the H-R diagram?