Measurement
 Imagine that you a preparing an international meal for your family. The appetizer, from France, uses 1.5 litrons of flour. The main course, a recipe from Venice, Italy, uses ½ mezzeni of olive oil, and the dessert, a recipe from Madrid, calls for 0.46001 libra of butter. All you have in your kitchen are tools that measure in cups, or tablespoons, or ounces. Can you imagine how difficult it would be to get the measurements correct? Now, imagine the same scenario in your science class – only this time your grade depends on replicating the results of a scientific experiment. Lucky for you, scientists worldwide have agreed to use the metric system.
The International System of Units (SI), or the metric system, is a collection of standard units for all types of measurements used worldwide. The United States is one of the only three countries that does not use the metric system on a national level. However, all countries (including the U.S.) use SI units for scientific purposes. It is important that scientists have a standardized system of measurement in order to share information. When scientists share information, they can collaborate, support each other’s work, and even catch mistakes. Scientists often make measurement of length, width, temperature, area, mass, volume, and density.
![]() Take a few moments to view the video English and Metric Measurement from eMediaVA. As you view the video, take note of how the person in the video converts the quantities. You will have to do the same thing later in this topic.
Take a few moments to view the video English and Metric Measurement from eMediaVA. As you view the video, take note of how the person in the video converts the quantities. You will have to do the same thing later in this topic.
Unit Prefixes
 The metric system is based on units of ten, which makes it much easier to understand and convert between bases. Each unit is ten times larger or smaller than the next unit. Converting from one unit of measure to another in the metric system is as simple as moving the decimal place to the left or to the right. If you are converting to a smaller unit of measurement, move the decimal to the right one space for each prefix. If you are converting to a larger unit of measurement, move the decimal to the left one space for each prefix.
Prefixes are added to the base units to represent a larger or smaller quantity. The table below shows the major prefixes used in the SI system. Based on the prefixes, a millimeter would represent 1/1000th of a meter, while a kilometer would equal 1000 meters. The metric system may seem confusing at first, but it is actually very easy to use because it is based on the number 10. For example, there are 10 millimeters in 1 centimeter, 100 centimeters in 1 meter, and 1000 meters in 1 kilometers.
Prefix |
Symbol |
Meaning |
Examples |
| kilo- | k | 1000 times the base unit | 0.001 kilometer 0.001 kiloliter 0.001 kilogram |
| hecto- | h | 100 times the base unit | 0.01 hectometer 0.01 hectoliter 0.01 hectogram |
| deka- | da | 10 times the base unit | 0.1 dekameter 0.1 dekaliter 0.1 dekagram |
| meter liter gram |
m l g |
the base unit | 1 meter 1 liter 1 gram |
| deci- | d | 1/10 of the base unit | 10 decimeters 10 deciliters 10 decigrams |
| centi- | c | 1/100 of the base unit | 100 centimeters 100 centiliters 100 centigrams |
| milli- | m | 1/1000 of the base unit | 1000 millimeters 1000 milliliters 1000 milligrams |
 Example 1:
If you wanted to convert 6000.0 meters to kilometers, you would have to move the decimal point over three places to the left. If you have converted this correctly, you will find that there are 6.0 kilometers found in 6000.0 meters.
 Example 2:
How many centigrams exist in 3.0 grams of salt? Hint: This time you have to move the decimal point to the right. If you have converted this correctly, you will find that there are 300.0 centigrams in 3.0 grams of salt.
Tables versus Graphs
Measurements collected during an experiment are called data. Data can be organized in either tables or graphs, depending on how the data is best presented. Tables are a good way to organize numerical data so that relationships between data points or sets of data are clear. Graphs are a good way to visually represent trends in the data.
When using tables to present data, the tables should have a clear title that describes the relationship between the data. If more than one table is used in a report, the tables should be numbered consecutively. The independent variable is always placed in the left column, and data that needs to be compared should be placed in adjacent columns.
Parts of a Graph
 Graphs may look simple, but they represent a great deal of information. A graph has several important parts that help visually display the patterns in a set of data. In this interactivity, click on each of the icons to learn more about the important parts of a graph. Click the player button to begin.
View a printable version of the interactivity.
Types of Graphs
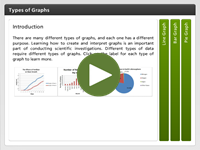 There are many different types of graphs, and each one has a different purpose. Learning how to create and interpret graphs is an important part of conducting scientific investigations in Biology. Different types of data require different types of graphs. In this interactivity, click on each bar in the accordion to learn about each type of graph. Click the player button to begin.
View a printable version of the interactivity.
Measurement Review

![]() Now that you have explored measurement, complete this non-graded activity to check your knowledge. In this activity, read each question, then select the appropriate answer. Click the player button to get started.
Now that you have explored measurement, complete this non-graded activity to check your knowledge. In this activity, read each question, then select the appropriate answer. Click the player button to get started.