


Mass, Volume, and Density
Density Scientific Investigation
![]() Before you begin the scientific investigation below, make sure to download the Density Scientific Investigation Report. As you complete this scientific investigation, fill in any needed information on the report template. If you need more information about each section of the report, please visit the Developmental Module.
Before you begin the scientific investigation below, make sure to download the Density Scientific Investigation Report. As you complete this scientific investigation, fill in any needed information on the report template. If you need more information about each section of the report, please visit the Developmental Module.
This scientific investigation is available below or in a printable version.
Please Note: This scientific investigation’s simulation is powered by Adobe® Flash®. Please make sure that you have access to a computer or mobile device that utilizes this software.
Introduction
Density is an important physical property of matter. Scientists calculate a substance's density by dividing the substance's mass by its volume. Mass is measured using a triple-beam balance or an electronic balance. Volume is measured through water displacement or by using a ruler. An object's density determines whether or not it will float in water.
Objectives
In this scientific investigation, you will:
- explore how changes to mass and volume impact a substance's density;
- measure the mass and volume of unknown substances;
- calculate density using mass and volume; and
- compare the density of an object to the density of water.
Hypothesis
Using the Procedure and Data Collection section below, read through the procedural information for this scientific investigation. Based on your understanding of the procedure, develop your own hypotheses, which describe your expected results. Specifically, what do you think the relationship among mass, volume, and density will be, especially if any of the components are modified? Record these hypotheses on your Density Scientific Investigation Report in the Hypothesis section.
Required Simulation
Density Simulation
(click on image below to access simulation)
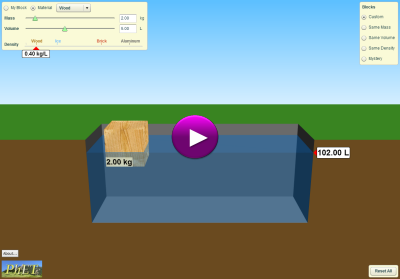
Provided by: PhET Interactive Simulations
University of Colorado
http://phet.colorado.edu
Procedure and Data Collection
Part 1: Explore the Simulation
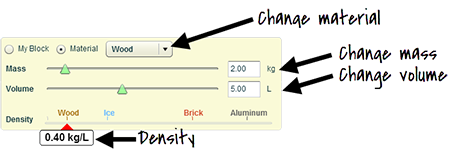 On the Density simulation webpage, click on the option for Material on the left side of the screen.
- To start, make sure that the Material dropdown menu is set to Wood.
- As seen in the image above, use the sliders to adjust the wood block's mass and volume. Consider how it impacts the density. Record three sets of mass and volume data points in the table provided in the Data section of your Density Scientific Investigation Report. The data table asks you to provide information in grams per milliliter, so make sure to convert your quantities using dimensional analysis. Also, record the wood block's density.
- Use the dropdown menu to change the block to a different substance. Repeat Step 3 for Ice, Brick, and Aluminum.
- In the Data section of your Density Scientific Investigation Report, create one graph using the three data points provided for each of the four different materials. Create a different colored line of regression for each material.
Part 2: Mystery Blocks
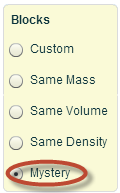 Now that you have some experience manipulating the simulation, click Mystery on the right side of the screen. You will be provided with five different colored blocks containing letters. In the Data section of your Density Scientific Investigation Report, complete the color row associated with each letter.
- Pick up the block A and place it on the scale provided on the left side of the screen. In the Data section of your Density Scientific Investigation Report, record the mass of block A. The data table asks you to provide information in grams, so make sure to convert your quantities using dimensional analysis.
- You will now use water displacement to calculate the volume of the block. First record the volume of the pool without any added objects. Place block A in the pool of water in the middle of the screen and pull it down to completely submerge it. Record the final volume of the pool. Subtract the pool's initial volume from the pool's final volume to find the volume of the block. In the Data section of your Density Scientific Investigation Report, record the volume of block A. The data table asks you to provide information in milliliters, so make sure to convert your quantities using dimensional analysis.
- Repeat Steps 2 through 3 for blocks B, C, D, and E. Make sure to record all of your data in the Data section of your Density Scientific Investigation Report.
- Once you have recorded the data for all of the blocks, calculate the density of each of the blocks using the correct units and number of significant figures.
 Once you have calculated the density of each of the mystery blocks, click the button to Show Table on the right side of the simulation screen. In the Data section of your Density Scientific Investigation Report, determine which block is which material and provide that information in the data table.
Data
An excerpt from the Data section of the Density Scientific Investigation Report is found below. Please make sure to complete all tables and requested data on the report itself.
Part 1: Explore the Simulation
Material |
Data Set 1 |
Data Set 2 |
Data Set 3 |
Density |
|||
Mass |
Volume (mL) |
Mass |
Volume (mL) |
Mass |
Volume (mL) |
||
Wood |
|
|
|
|
|||
Ice |
|
|
|
|
|||
Brick |
|
|
|
|
|||
Aluminum |
|
|
|
|
|||
Once you have completed this data chart, create one graph using the three data points provided for each of the four different block materials. Create a different colored line of regression for each block. Make sure to design and label your graph correctly.
Part 2: Mystery Blocks
Block |
Block Color |
Mass of Block (g) |
Initial Volume of Pool |
Final Volume of Pool with Block (mL) |
Volume of Block (mL) |
Density of Block (g/mL) |
Identity of Block |
A |
|
|
|
|
|
|
|
B |
|
|
|
|
|
|
|
C |
|
|
|
|
|
|
|
D |
|
|
|
|
|
|
|
E |
|
|
|
|
|
|
|
Data Analysis
In the Data Analysis section of your Density Scientific Investigation Report, provide responses to the following questions:
- Based on your graph from Part 1 of the Density Scientific Investigation, what do the slopes of your lines of regression indicate about mass volume and density?
- What is the density of water?
- Based on the data that you collected in Part 2 of the Density Scientific Investigation, which of the blocks would have floated?
- How would this scientific investigation have changed if a liquid with a higher density was used?
Conclusion
Using the Conclusion section of your Density Scientific Investigation Report, compose three to four sentences describing an overall conclusion about the relationship among mass, volume, and density, especially if any of these particles are added or subtracted from the atom. Were your hypotheses true or false, and how do you know? Use the data and notes that you collected from your simulation experience to form your conclusion. Make sure that you include information that you gained from data analysis to support your conclusion.
Experimental Sources of Error
On your Density Scientific Investigation Report, provide responses to the following questions: Are there any sources of error? If so, what are they, and what could be done to minimize error?
![]() Once you have completed the Density Scientific Investigation Report, please submit your work to the dropbox.
Once you have completed the Density Scientific Investigation Report, please submit your work to the dropbox.