


Virginia Geology and Resources
Virginia's Resource Usage
![]() Over the last 150 years, resource use in the United States has changed to include more alternative sources of energy. While petroleum is still the dominant energy resource used in the United States, the country is making progress in using cleaner energy resources to satisfy its energy demands. Take a moment to review the History of Energy Consumption in the United States, 1775-2012 graph below.
Over the last 150 years, resource use in the United States has changed to include more alternative sources of energy. While petroleum is still the dominant energy resource used in the United States, the country is making progress in using cleaner energy resources to satisfy its energy demands. Take a moment to review the History of Energy Consumption in the United States, 1775-2012 graph below.
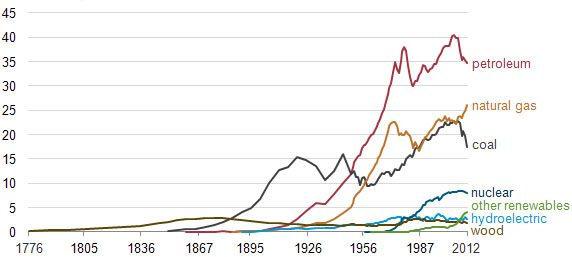
Courtesy of US Energy Information Administration - Annual Energy Review 2009
History of Energy Consumption in the United States, 1775-2012
Based on the History of Energy Consumption in the United States, 1775-2012 graph, what would you assume a similar graph of Virginia’s energy resource consumption would look like? Would it be the same? What sources of energy does Virginia use the most? What sources of energy does Virginia use the least? In this assignment, you will compare Virginia's resource usage from 150 years ago to resource usage at the present time.
This assignment is available below or you will download and fill out the Virginia’s Resource Usage Template to complete each part of the assignment.
Part I – Virginia Resources 150 Years Ago
In the first part of this assignment, you are to create a pie chart that displays what Virginia’s energy resource usage could have looked like 150 years ago. Use the information from the History of Energy Consumption in the United States, 1775-2012 to infer what the percentages of resource usage would have looked like then. Your pie chart should include percentages of petroleum, natural gas, coal, nuclear, hydroelectric, wood, and other renewable resources. If only two resources were being utilized 150 years ago, only two resources should be represented on the pie chart. To complete this part of the assignment, fill out the table below and then construct a pie chart to display the information.
| Resource | Percentage Used 150 Years Ago |
| Petroleum | |
| Natural Gas | |
| Coal | |
| Nuclear | |
| Hydroelectric | |
| Wood | |
| Other Renewable Resources |
Use the blank space below to create a pie chart that displays the percentage of resources used 150 years ago.
|
Part II – Virginia Resources Today
In the second part of this assignment, you are to research the resource usage in Virginia for the present time. You should find what percentage of petroleum, natural gas, coal, nuclear, hydroelectric, wood, and other renewable resources are used to produce energy in Virginia today. Once you have this information, you should create a pie chart to display this information.
| Resource | Percentage Used 150 Years Ago |
| Petroleum | |
| Natural Gas | |
| Coal | |
| Nuclear | |
| Hydroelectric | |
| Wood | |
| Other Renewable Resources |
Use the blank space below to create a pie chart that displays the percentage of resources used at the present time.
|
Part III – Analyzing the Change in Resource Usage
Once you have completed your two pie charts comparing present and past resource use in Virginia, answer the following data analysis questions.
- How has resource use in Virginia changed over time?
- What are reasons resource use in Virginia has changed over time? Cite specific examples.
- What resource is used the most in Virginia at the present time? Why is this resource utilized the most?
- What resource is used the least in Virginia at the present time? Why is this resource not utilized more often?
- How do you think resource usage in Virginia will change over the next 150 years? Explain your answer.
If resources outside of this course are used to complete this assignment, please submit a Works Cited document. If you need assistance, visit the Developmental Module for information on citing any resources that you used.
![]() Once you have completed your assignment, please submit your work and Works Cited document to the dropbox.
Once you have completed your assignment, please submit your work and Works Cited document to the dropbox.