


Salinity and Ocean Circulation
Option A: Dissolved Substances Scientific Investigation
![]()
 Before you begin the scientific investigation below, make sure to download the Dissolved Substances Scientific Investigation Report. As you complete this scientific investigation, fill in any needed information on the report template. If you need more information about each section of the report, please visit the Developmental Module.
This scientific investigation is available below or in a printable version.
Introduction
Seawater owes its salty taste to the high quantities of dissolved salts, gasses, and other minerals in the water. Scientists measure the amount of dissolved substances in seawater to determine its salinity. Although the salinity of seawater varies from place to place, in general it has a salinity of about 3.5%. When water cycles into seawater through precipitation, runoff, and melting icebergs, the concentration of dissolved substances decreases, thus lowering the overall salinity. When water cycles out of the seawater through the formation of sea ice and evaporation, the concentration of dissolved substances increases, thus raising the overall salinity.
Objectives
In this scientific investigation, you will:
- explore the relationships between salinity, dissolved substances, and the quantity of water.
- observe the changes in concentration when a solvent is added to a solute.
Hypothesis
Using the Procedure and Data Collection section below, read through the procedural information for this scientific investigation. Based on your understanding of the procedure, develop your own hypotheses which describe your expected results. What do you think the relationship between the solute (water), the solvent (salt), and the solution (the mixture) will be when different amounts of each are added and subtracted? Record these hypotheses in the Hypothesis section of your Dissolved Substances Scientific Investigation Report.
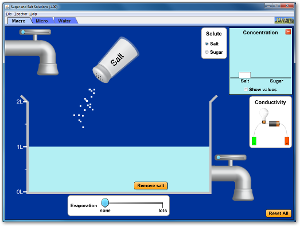
Required Simulation
Sugar and Salt Solutions Simulation
(click the image below to run simulation)
Provided by:
PhET Interactive Simulations
University of Colorado
http://phet.colorado.edu
Procedure and Data Collection
Simulation Set-Up (see image at right)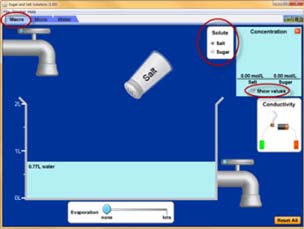
- Open the Sugar and Salt Solutions simulation.
- In the upper left corner of the simulation, make sure that the Macro tab is selected.
- In the Solute box, click the Salt button.
- In the Concentration box, click the checkbox to Show values.
Effect of Added Solvent on the Concentration of the Solution
- Use your cursor to grab and shake the salt shaker, shaking it eight times to add salt to the water.
- Remove your cursor from the salt shaker.
- In the Data section of your Dissolved Substances Scientific Investigation Report, record the effect of added solvent (salt) on the salinity of the solution. How many mol/L of salt is present in the solution?
- Effect of Added Solute on the Concentration of the Solution
- Use your cursor to move the button on the upper left water faucet to the right, adding 0.5 L of water into the solution.
- Turn the water off.
- In the Data section of your Dissolved Substances Scientific Investigation Report, record the effect of added solute (water) on the salinity of the solution. How many mol/L of salt is present in the solution?
Effect of Solution Quantity on the Concentration of the Solution
- Use your cursor to move the button on the lower right water faucet to the right, removing 1 L of the solution.
- Turn the water off.
- In the Data section of your Dissolved Substances Scientific Investigation Report, record the effect of removed solution on the salinity of the solution. How many mol/L of salt is present in the solution?
Data
Use the data table provided on your Dissolved Substances Scientific Investigation Report to record your data from this scientific investigation. The data table is also shown below:
Effect of Added Solvent and Solute on Salinity
| Change | Amount Added | Salinity/Salt Concentration (mol/L) |
| Added solvent (salt) | ||
| Added solute (water) | ||
| Removed solution |
Data Analysis
In the Data Analysis section of your Dissolved Substances Scientific Investigation Report, provide responses to the following questions:
- Describe what happened to the salinity of the solution when you added salt. Explain why.
- Describe what happened to the salinity of the solution when you added water. Explain why.
- Describe what happened to the salinity of the solution when you removed solution. Explain why.
- List all of the different ways that you can change the concentration of a solution.
Conclusion
Using the Conclusion section of your Dissolved Substances Scientific Investigation Report, compose three to four sentences describing an overall conclusion about the relationship between the solute (water), the solvent (salt), and the solution (the mixture) will be when different amounts of each are added and subtracted, based on your data. Were your hypotheses true or false, and how do you know? Use the data and notes that you collected from your simulation experience to form your conclusion. Make sure that you include information that you gained from data analysis to support your conclusion.
Experimental Sources of Error
On your Dissolved Substances Scientific Investigation Report, provide responses to the following questions: Are there any sources of error? If so, what are they, and what could be done to minimize error?
![]() Once you have completed the Dissolved Substances Scientific Investigation Report, please submit your work to the dropbox.
Once you have completed the Dissolved Substances Scientific Investigation Report, please submit your work to the dropbox.
Option B: Salinity and Deep Ocean Currents Scientific Investigation
![]() Before you begin the scientific investigation below, make sure to download the Salinity and Deep Ocean Currents Scientific Investigation Report. As you complete this scientific investigation, fill in any needed information on the report template. If you need more information about each section of the report, please visit the Developmental Module.
Before you begin the scientific investigation below, make sure to download the Salinity and Deep Ocean Currents Scientific Investigation Report. As you complete this scientific investigation, fill in any needed information on the report template. If you need more information about each section of the report, please visit the Developmental Module.
This scientific investigation is available below or in a printable version.
Introduction
Ocean currents are formed many ways. For example, wind moves the water along the surface to form wind-driven currents or surface currents. Deep ocean currents are caused by differences in water temperature and salinity.
Objectives
In this scientific investigation, you will:
- explore the relationship between salinity and density in deep water currents.
Hypothesis
Using the Procedure and Data Collection section below, read through the procedural information for this scientific investigation. Based on your understanding of the procedure, develop your own hypotheses which describe your expected results. Record your hypotheses in the Hypothesis section of your Salinity and Deep Ocean Currents Scientific Investigation Report.
Equipment and Materials
- 4 small jars (like baby food jars)
- 2 index cards or card stock
- Table salt
- 2 colors of food coloring
- Towels
Procedure and Data Collection
WARNING: It is recommended that you conduct this scientific investigation in an area where water spills will not cause damage. In addition, you should not conduct this experiment near any electrical devices.
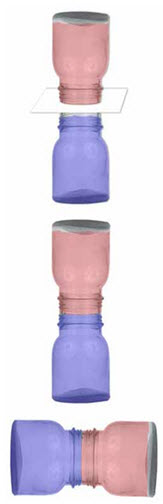 Fill both baby food jars with water. Dissolve the salt in one of the jars and add a drop of blue food coloring. Make sure to mark the jar "Salt Water." Add a drop of red food coloring to the other jar and label it "Fresh Water."
- Place one of your index cards or pieces of card stock on top of the salt water jar to cover the opening, and carefully keep your hand over the card and the jar as you turn the jar over.
- Place the saltwater jar on top of the fresh water container and carefully remove the card while the two jars are on top of each other in order to uncover the opening to the jar with the blue water or "salt" water. In the Data section of your Salinity and Deep Ocean Currents Scientific Investigation Report, observe and make notes of the results.
- Use the second set of jars to repeat the experiment. This time, cover the opening to the red-water or fresh-water jar with the other index card or card stock, carefully keep your hand over the card as you turn the entire jar over and place it on top of the saltwater jar. Remove the card to uncover the opening. In the Data section of your Salinity and Deep Ocean Currents Scientific Investigation Report, observe and make notes of the results.
- Take each set of jars and turn it horizontally by holding the salt-water jar in one hand and the fresh-water jar in the other and apply horizontal pressure to keep the openings in line. In the Data section of your Salinity and Deep Ocean Currents Scientific Investigation Report, observe and make notes of the results.
Data
Use the spaces provided in the Data section of your Salinity and Deep Ocean Currents Scientific Investigation Report to record your data from this scientific investigation.
Data Analysis
In the Data Analysis section of your Salinity and Deep Ocean Currents Scientific Investigation Report, provide responses to the following questions. Make sure to completely answer each question.
- Is salt water heavier or lighter (higher or lower in density) than fresh water? Make sure that you explain your answer in terms of the results that you obtained from your experiment.
- If evaporation causes surface water to be salty, where would you expect ocean water to be very dense?
- Does this correspond to where deep ocean currents originate?
- Does the density of ocean water have any relationship to the temperature of ocean water?
Conclusion
Using the Conclusion section of your Salinity and Deep Ocean Currents Scientific Investigation Report, compose three to four sentences describing an overall conclusion about the relationship between salinity, density, and deep ocean currents. Were your hypotheses true or false, and how do you know? Use the data and notes that you collected from your simulation experience to form your conclusion. Make sure that you include information that you gained from data analysis to support your conclusion.
Experimental Sources of Error
On your Salinity and Deep Ocean Currents Scientific Investigation Report, provide responses to the following questions: Are there any sources of error? If so, what are they, and what could be done to minimize error?
![]() Once you have completed the Salinity and Deep Ocean Currents Scientific Investigation Report, please submit your work to the dropbox.
Once you have completed the Salinity and Deep Ocean Currents Scientific Investigation Report, please submit your work to the dropbox.