


Stellar Evolution and Classification
The Evolution of Stars
 Astronomers have learned that stars evolve, or change over time. Some stars have existed almost since the origin of the universe and other stars, such as the Sun, were created later from matter recycled from previous stars. Through their observations, astronomers have studied and charted the life cycle of stars from birth to death. View this presentation to learn more about stellar evolution. Click the player button to begin.
View a printable version of the interactivity.
![]() To learn more about the deaths of stars, view the video 1967 - Dwarfs; Neutron Stars; Pulsars, and Black Holes from eMediaVA℠. As you view the video, make note of how these deaths can bring about the births of new stars.
To learn more about the deaths of stars, view the video 1967 - Dwarfs; Neutron Stars; Pulsars, and Black Holes from eMediaVA℠. As you view the video, make note of how these deaths can bring about the births of new stars.
The Hertzsprung-Russel Diagram
The Hertzsprung-Russell diagram is a scatter plot of stars showing the relationships between the stars' absolute magnitudes, luminosity, their spectral types or classifications, and their temperatures. This graph was created in 1910 by Ejnar Hertzsprung and Henry Russell. Both astronomers worked together to create this diagram. The H-R diagram can be interpreted by analyzing the four factors that can make up the axis labels.
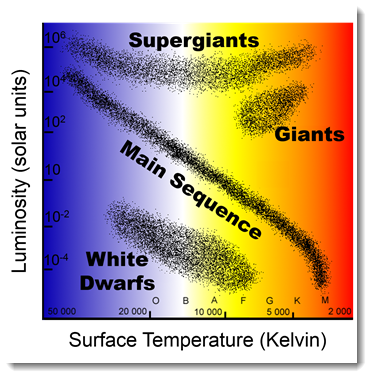 Temperature: Temperature is measured in degrees Kelvin. On this scale, the temperature of stars can range from around 3,000 K to about 40,000 K. Cooler stars include older main sequence stars and giants. Hotter stars include white dwarfs and younger main sequence stars.
- Absolute Magnitude: Absolute magnitude is how bright an object is. Large stars, like super giants and giants, have very low absolute magnitudes, while older main sequence stars, like Betelgeuse, have high absolute magnitudes.
- Luminosity: Luminosity is the amount of radiation a star gives off in a certain time. Younger main sequence stars, giants, and supergiants have a high luminosity, while white dwarfs have a low luminosity.
- Spectral Class: The spectral classes are divided into seven different categories. Each star's spectral class has a color. In order of decreasing mass and temperature, the seven classes of stars are O, B, A, F, K, and M stars.
 The Hertzsprung-Russel diagram provides unique insight into the composition and life of stars. In this interactivity, read the introduction and then explore the H-R diagram. Click on each of the spinning dots to learn about the different areas on the diagram.
View a printable version of the interactivity.
Parallax
 One of the most difficult problems is astronomy is determining the distances to objects in the sky. Even when observed with the largest telescopes, stars are still just points of light. Although astronomers can tell a lot about a star through its light, these observations do not give us a reference scale to use to measure their distances. Astronomers rely on a phenomenon you are already familiar with called parallax to determine the distance of stars from Earth.
You can see parallax in action by holding your thumb out at arm's length. Hold you thumb in front of any nearby object and view that object by closing one eye and then switching to the other eye. Your thumb should seem to jump back and forth relative to the object. This is because your eyes are a few centimeters apart, so each eye has a different point of view. Scientists use this same method to determine the relative distance to stars. The more a star shifts in a field of vision, the closer it is.
Groups of Stars
Groupings of stars occur differently in space. These star groupings can be as small as binary star systems, which include two stars, or as large as galaxies, the smallest of which includes at least one thousand stars. All binary star systems have the same basic type of orbit. There is a center of mass located somewhere in between the two stars around which each star orbits. This center of mass is the point where the stars' masses are equal and it is always closer to the more massive star. There are a few basic ways to observe binary systems. Binary systems can be viewed visually, spectroscopically, or when they eclipse.
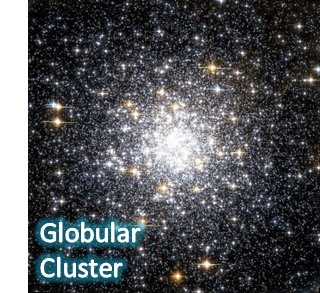
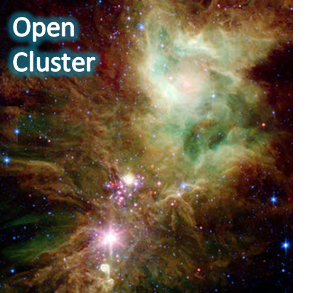
There are two types of star clusters; globular clusters and open clusters. Globular clusters are tighter groupings of stars. These clusters can contain hundreds of thousands of stars. Open clusters are loosely clustered groupings of stars containing less than one hundred members. Generally, stars are much younger in a globular cluster.
Constellations
More than 3,000 years ago, the Babylonians recognized star patterns or constellations in the sky and divided the sky into twelve divisions, just like a pie with twelve slices. Each slice corresponded to a month in the Babylonian twelve-month calendar. Centuries later, the Greeks, namely the astronomer Ptolemy, built upon the Babylonian zodiac and refined it. The twelve constellations of the zodiac that is still used today reflect this Greek influence and the patterns the ancient people saw when they looked upward into the night sky.
 What exactly are constellations? Are they real? Are all stars part of a constellation? How do they relate to the zodiac? These are questions that you may be asking as yourself as you look into the night sky. View this presentation to learn more about constellations.
View a printable version of the interactivity.
Stellar Evolution and Classification Review

![]() Now that you have studied stellar evolution and classification, review your knowledge in this non-graded activity. Read the directions associated with each question and select the correct answer(s). Then, click SUBMIT to check your response(s). Click the player button to get started.
Now that you have studied stellar evolution and classification, review your knowledge in this non-graded activity. Read the directions associated with each question and select the correct answer(s). Then, click SUBMIT to check your response(s). Click the player button to get started.