Physical and Climate Regions
Regions
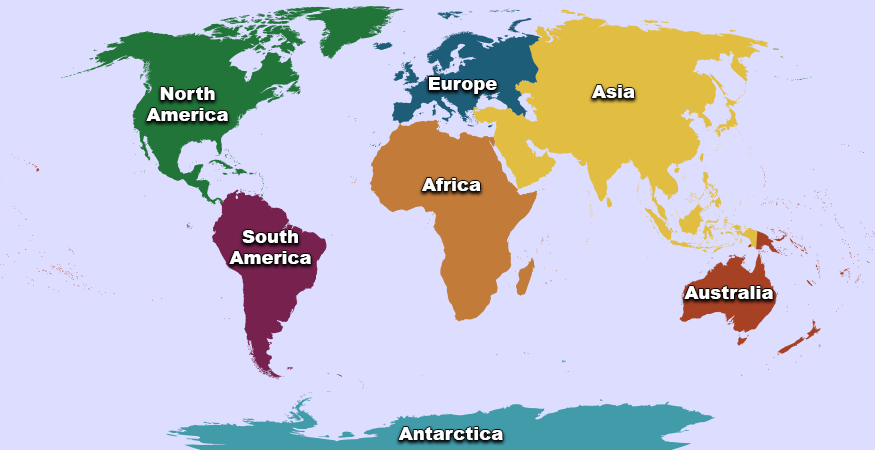
Map of World Regions: Detailed Description
Geographers use regions because it allows them to break the world down into smaller parts. Such regions include elements like culture, economics, climate, or other characteristics. For example, one common way to divide the world is by continent, as demonstrated in the map above. Another common way to divide the world is by physical region. This is an area divided by natural borders with similar physical characteristics.
Weather Phenomena

The long term effects of climate are important. Also, several types of weather phenomena impact the Earth's surface and how people live. This includes phenomena like monsoons, hurricanes, typhoons, and tornadoes. In this interactivity, you will learn more about various types of weather phenomena. Click the player to begin.
View a printable version of this interactivity or an ADA compliant transcript.
Climate Graphs
A climate graph, also called a climograph, can help you visualize an area's climate. It consists of a simple line graph showing an area’s average monthly temperature. This simple line graph is superimposed over a bar graph to show the area’s average monthly precipitation. The x-axis includes the months of the year. The two y-axes include temperature (in °F or °C) and precipitation (in millimeters or inches). When interpreting graphs, remember to examine the measurements. For example, think about how a graph's meaning changes if it depicts temperature in degrees Fahrenheit versus Celsius.
You can learn a lot about a place’s climate by examining its climate graph. For instance, the climate graph below is for Edinburgh, Scotland. Notice that Edinburgh experiences mild temperatures and evenly distributed rainfall throughout the year.
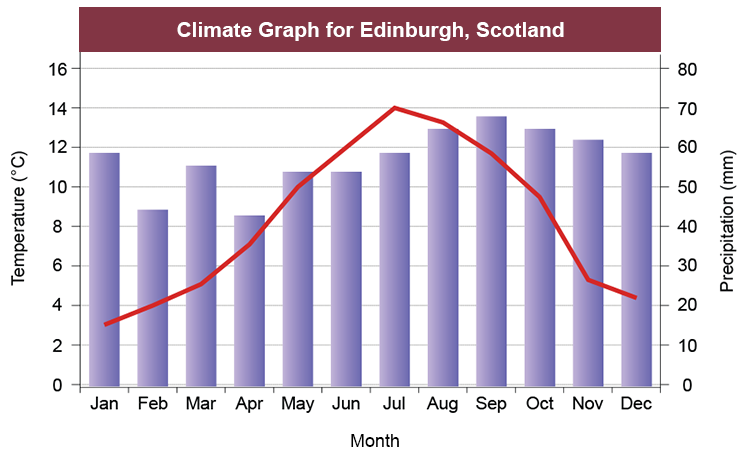
Climate Graph for Ediburgh, Scotland: Detailed Description
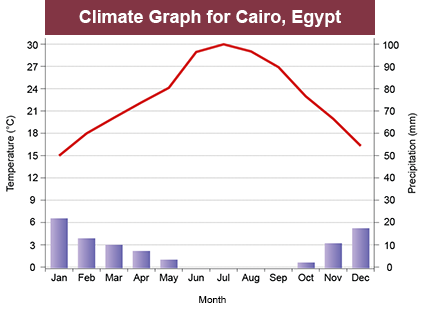
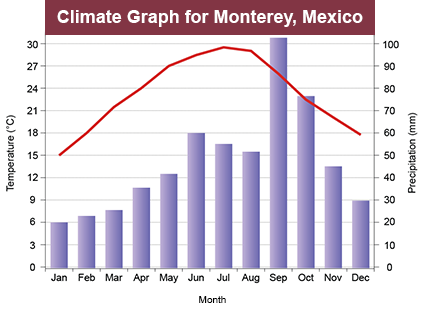
Climographs also allow you to compare climates of more than one location. For example, look at the two climate graphs below for Cairo, Egypt and Monterey, Mexico. Both cities have similar temperatures throughout the year. However, Cairo receives much less rainfall than Monterey. A number of factors can cause these climate differences.
Factors that Affect Climate

Have you ever wondered why different places have different climates? What causes them to have varying combinations of temperature and precipitation? Why do some areas have hot summers but cold winters? In this interactivity, you will discover six primary factors that affect a place's climate. Click the player to begin.
View a printable version of this interactivity or an ADA compliant transcript.
Climate Review

 Now that you have learned about climate, review your knowledge in this interactivity. Click the player to get started.