Application

The Caribbean

Caribbean Island Exports

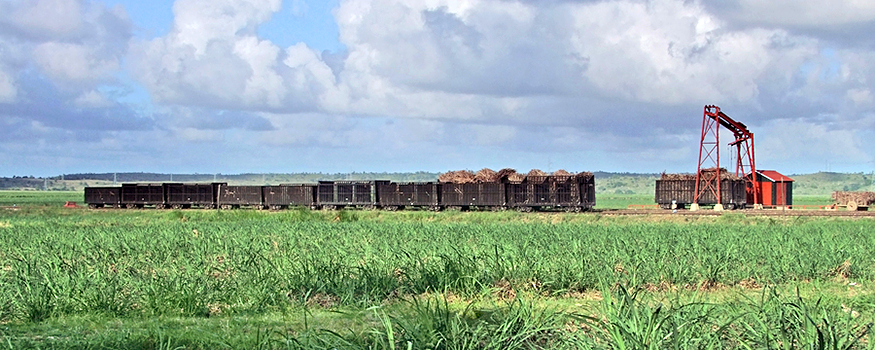
Harvesting sugar cane in the Dominican Republic

In this topic, you learned that individual Caribbean economies vary. This depends on available natural resources. For this assignment, you will create a set of five coordinated pie graphs. Every graph should depict the main exports from each of the countries represented in the table below. Please clearly label each country’s pie graph with individual exports. Differentiate the exports by color, shading, or a similar graphical element.

Major Exports of the Caribbean Islands
Cuba Agricultural Goods 72%, Metals 12%, Chemicals 9%, Other 7%
Dominican Republic Agricultural Goods 23%, Precious Metals 20%, Textiles/Apparel 18%, Medical Equipment 14%, Other 25%
Haiti Textiles/Apparel 90%, Other 10%
Jamaica Aluminum/Bauxite 50%, Agricultural Goods 32%, Other 18%
Trinidad and Tobago Oil/Petroleum Products 55%, Chemicals 32%, Other 13%

Options to create your graphs include:

  1. Hand-draw the graphs and then take pictures for submission to the assignment’s dropbox.
  2. Hand-draw the graphs and then scan them for submission to the assignment’s dropbox.
  3. Utilize a paint, presentation, word processing, or graphics program to create the graphs. You can then submit your work to the assignment’s dropbox.
  4. Use a web-based or mobile application to create the graphs. You can then email or export the final product for submission to the assignment’s dropbox.

Once you have completed your pie graphs, take a moment to compare the data. Then, answer the following questions based on your observations.

  1. Besides tourism, what are two different ways Caribbean nations make money?
  2. Which nation appears to have the most diverse economy? Why?
  3. Which nation appears to have the least diverse economy? Why?

Before you begin, access the Caribbean Island Exports Checklist to be sure you include all items required for full credit.


After completing this assignment, please submit your work to the dropbox.