Population Dynamics
Populations are impacted by both living and non-living factors in their environments. The living factors are called biotic factors, and the non-living factors are called abiotic factors. Roll your cursor over the images below to learn more about these biotic and abiotic factors.


View a printable version of the interactivity.
Characteristics of Populations
Limiting Factors and Carrying Capacity
 The size of a population is determined almost exclusively by the resources available in the population's environment. The availability of necessary abiotic and biotic factors impact whether a population grows, decreases, or stays relatively stable. When one of these factors limits a population's growth, it is known as a limiting factor. For example, plants in freshwater aquatic ecosystems need phosphorous to grow. When the phosphorous in the water becomes depleted, then the plants can no longer grow and reproduce. In this instance, the phosphorous is the limiting factor. Common limiting factors are food, water, shelter, and space. Other limiting factors include the predation, natural disasters, and availability of mates.
There is a maximum number of organisms that an environment can support due to the availability of resources. This is known as the carrying capacity. Because the limiting factors can change due to the climate and interactions with other species, the carrying capacity is not always the same; it changes as resources change.
Population Density
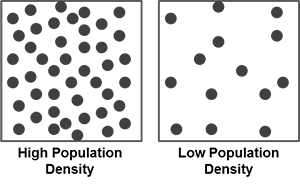 When many organism live in one area of an ecosystem, that area is said to have a high population density. Population density is the number of organisms per square measurement of area. Often, the measurement is represented as "per square kilometer" or "per square mile". In the image shown here, pretend that each one of these dots represents an organism, like a chameleon, which is a small lizard. Each of the sections represent one square mile. In the high population density image, you can see that there are more chameleons in the square compared to the low population density image, in which there are fewer chameleons in the same amount of space.
Population Curves
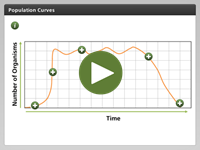 A population curve is a depiction of the population of a species over time. On these graphs, time is located on the x-axis, and the size of the population is located on the y-axis. Learn more about the different features of populations curves by clicking on the spinning icons in this interactivity. Click the player button to begin.
View a printable version of the interactivity.
Studying Populations
 Ecologists use several methods for studying populations, including quadrat studies, random sampling, and models/simulations. In quadrat studies, ecologists measure a population's density and distribution within a measured area called a quadrat, or square. For example, an ecologist wishing to study the population density and distribution of ants may divide a geographic area into many equally sized quadrats, each measuring one square meter. The ecologist would then count the number of individuals within each quadrat to estimate the population's size and distribution.
In random sampling, ecologists attempt to measure a population's density and distribution by making inferences about the overall population based on observations of a smaller number of individuals, which are selected at random. One such random sampling technique is called catch and release. In this technique, a small number of individuals are repeatedly captured, observed, and released back into the population. For example, an ecologist wishing to study a population of eagles would capture several individuals, take careful measurements of their size, weight, age, and overall health, and then release each eagle with a small tag or tracker attached. Over time, the ecologist would attempt to find or catch each individual to repeat the measurements. From these observations, the ecologist can make inferences about the overall density, distribution, and health of the population within a given geographic area.
Scientists often use sophisticated computer applications to model or simulate what is happening to a population in the wild. These computer models allow ecologists to make predictions on what will occur in the future based on how the population has behaved in the past. They can change different biotic and abiotc factors to see how the change impacts a population. This allows them to study a species without having to conduct direct experimentation on organisms.
Population Dynamics Review

![]() Now that you have examined population dynamics, review your knowledge in this non-graded activity. Read each statement and type in the correct word or words to complete the information. Then, click SUBMIT to check your response. Click the player button to get started.
Now that you have examined population dynamics, review your knowledge in this non-graded activity. Read each statement and type in the correct word or words to complete the information. Then, click SUBMIT to check your response. Click the player button to get started.