Chemical Reactions and Enzymes
![]() Before you begin the scientific investigation below, make sure to download the Enzymatic Browning Scientific Investigation Report. As you complete this scientific investigation, fill in any needed information on the report template. If you need more information about each section of the report, please visit the Developmental Module.
Before you begin the scientific investigation below, make sure to download the Enzymatic Browning Scientific Investigation Report. As you complete this scientific investigation, fill in any needed information on the report template. If you need more information about each section of the report, please visit the Developmental Module.
This scientific investigation is available below or in a printable version.
Introduction
Have you ever reached into a fruit bowl and grabbed a piece of fruit, only to notice that it is soft and brown? Or have you sliced a raw potato for French fries, but let them sit while you did something else only to come back to brown, unappetizing food? The brown color is the result of a chemical reaction involving enzymes called oxidation. This reaction occurs when a group of enzymes called polyphenol oxidases in the plant cells are exposed to oxygen.
Objectives
In this scientific investigation, you will:
- investigate factors that will slow the oxidation reaction.
Hypothesis
Using the Procedure and Data Collection section below, read through the procedural information for this scientific investigation. Based on your understanding of the procedure, develop your own hypotheses which describe your expected results. You should consider the following questions: Which treatment, if any will slow the oxidation reaction? What are the practical applications of this information? Record your hypotheses in the Hypothesis section of your Enzymatic Browning Scientific Investigation Report.
Equipment and Materials
- Pears
- Tongs
- Paper Towels
- Knife
- Metric Ruler
- 5 Heat Resistant Cups
- Measuring Cup
- Timer or Stopwatch
- pH Test Strips
- 100 mL Lemon Juice
- 300 mL Water
- 100 mL White Vinegar
- 25 g (Roughly Two Tablespoons) Sugar
- 35 g (Roughly Two Tablespoons) Salt
Procedure and Data Collection
- Place 6 small paper towel squares on a flat surface.
- In one of each of the five cups, prepare each of the following liquids or solutions:
- Boiling water (100 mL)
- A sugar solution (100 mL water and 30 mL sugar, stirred until dissolved)
- A salt solution (100 mL water and 30 mL salt, stirred until dissolved)
- Lemon juice (100 mL)
- White vinegar (100 mL)
- Using five individual pH test strips, measure and record the pH of each liquid. Record this information in the Data area of your Enzymatic Browning Scientific Investigation Report.
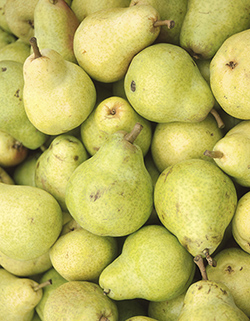
 Slice the pears into six 4 cm2 squares, with the peel intact on one side. Make sure that the flesh is not bruised. The image on the right shows an example of a 4 cm2 square of pear with the peel intact on one side.
- Using the tongs, immediately submerge one of each of 5 pear squares into a different liquid. Set the remaining square to the side on one of the paper towels.
- Using a timer or stopwatch, leave the pears submerged for 3 minutes. After 3 minutes, use the tongs to remove the pears and place them each on a paper towel peel side down.
- Using a timer or stopwatch, leave pears on the paper towel for 10 minutes.
- After 10 minutes, observe any discoloration on the pear. Use the metric ruler to measure the area of the discoloration. Record this information in the first row for each solution in the Data area of your Enzymatic Browning Scientific Investigation Report.
- Using a timer or stopwatch, repeat Step 8 at the 20 minute and the 30 minute marks.
- In the second row for each solution in the Data area of your Enzymatic Browning Scientific Investigation Report, calculate the percentage of pear that has browned for each square at each time interval. Use this equation to calculate the percentage:
(area browned / total area of square) x 100 = percentage of pear that has browned
Data
Use the table provided in the Data section of your Enzymatic Browning Scientific Investigation Report to record your data from this scientific investigation. The data table is also shown below:
| Liquid or Solution | Measurement | Time Increment | ||
| 10 Minutes | 20 Minutes | 30 Minutes | ||
| Boiling Water | Brown Area (cm2) | |||
| Percentage of Pear That Has Browned | ||||
| Sugar Solution | Brown Area (cm2) | |||
| Percentage of Pear That Has Browned | ||||
| Salt Solution | Brown Area (cm2) | |||
| Percentage of Pear That Has Browned | ||||
| Lemon Juice | Brown Area (cm2) | |||
| Percentage of Pear That Has Browned | ||||
| White Vinegar | Brown Area (cm2) | |||
| Percentage of Pear That Has Browned | ||||
| None | Brown Area (cm2) | |||
| Percentage of Pear That Has Browned | ||||
As part of your data collection, create a line graph that shows the percentage of pear that has browned at each time increment for each of the different solutions. Each solution should be represented by a different colored line, and the graph should include a key. In addition, make sure to include labels and a title for your graph.
Data Analysis
In the Data Analysis section of your Enzymatic Browning Scientific Investigation Report, provide responses to the following questions. Make sure to completely answer each question.
- How did each treatment affect the chemical reaction that occurred in the pear? Summarize the information that you collected in your data table.
- Based on your data, which treatment was the most effective in preserving the fruit?
- Based on your data, which treatment was the least effective in preserving the fruit?
- Based on the information that you learned in this topic, compose three to four sentences explaining why some treatments were more effective than others.
- Pretend that your parents are planning a dinner party and that they want to set out a tray of apples, pears, and bananas. What recommendations would you make for keeping the fruit fresh, based on what you learned in this scientific investigation?
Conclusion
Using the Conclusion section of your Enzymatic Browning Scientific Investigation Report, compose three to four sentences describing an overall conclusion based on your data. Was your hypothesis supported or not, and how do you know? Use the data and notes that you collected from you experience to form you conclusion. Make sure that you include information that you gained from data analysis to support your conclusion.
Experimental Sources of Error
On your Enzymatic Browning Scientific Investigation Report, provide responses to the following questions: Are there any sources of error? If so, what are they, and what could be done to minimize error?
![]() Once you have completed the Enzymatic Browning Scientific Investigation Report, please submit your work to the dropbox.
Once you have completed the Enzymatic Browning Scientific Investigation Report, please submit your work to the dropbox.