


pH and pOH
![]() Before you begin the scientific investigation below, make sure to download the pH Scale Scientific Investigation Report. As you complete this scientific investigation, fill in any needed information on the report template. If you need more information about each section of the report, please visit the Developmental Module.
Before you begin the scientific investigation below, make sure to download the pH Scale Scientific Investigation Report. As you complete this scientific investigation, fill in any needed information on the report template. If you need more information about each section of the report, please visit the Developmental Module.
This scientific investigation is available below or in a printable version.
Introduction
The pH scale measures the acidity of a solution. The pH scale ranges from zero to fourteen. The pH scale number actually denotes the number of hydrogen (hydronium) ions or hydroxide ions. Solutions with a high concentration of hydronium (H3O+) have a lower pH. Solutions with a higher concentration of hydroxide (OH-) have a higher pH. On the pH scale, any solution with a lower pH is considered to be an acid, while any solution with a high pH is considered to be basic.
Objectives
In this scientific investigation, you will:
- observe how the concentrations of hydronium and hydroxide change by lowering or raising the pH of a solution.
- observe the pH, hydronium concentration, and hydroxide concentration in certain common solutions.
Hypothesis
Using the Procedure and Data Collection section below, read through the procedural information for this scientific investigation. Based on your understanding of the procedure, develop your own hypotheses which describe the expected results. You should consider the following questions: How does the concentration of hydronium and hydroxide change with pH? How does the pH, concentration of hydronium, and concentration of hydroxide ions differ in common solutions? Record these hypotheses in the Hypothesis section of your pH Scale Scientific Investigation Report.
Required Simulation
pH Scale
(click on image below to run simulation)
Provided by:
PhET Interactive Simulations
University of Colorado
http://phet.colorado.edu
Procedure and Data Collection
Simulation Set-Up
 Open the pH Scale simulation.
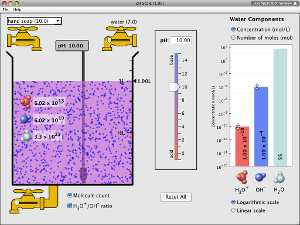
- Take a few moments to become familiar with the simulator. Adjust the pH scale bar, adjust the concentration of hydronium, adjust the concentration of hydroxide, and use the drop-down menu to view different solutions. View the image to the right to see where each of these controls are located.
- Once you are done experimenting with the simulation, click Reset All to reset the simulation.
Procedures
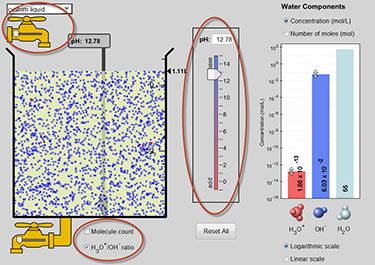
- Make sure that the check box labeled H3O+/OH- ratio is checked. In the solution, the red dots represent hydronium ions and blue dots represent hydroxide ions.
- Adjust the pH slider up and down; observe how moving the slider changes the number of each type of ion. On your pH Scale Scientific Investigation Report, make some general observations about what happens when you raise the pH slider up. On your pH Scale Scientific Investigation Report, make some general observations about what happens when you lower the pH slider down.
- Click Reset All to reset the simulation. Make sure that the check box labeled H3O+/OH- ratio is checked.
- Using the drop-down menu in the top left corner, record the pH, H3O+ content, and the OH- content for each of the substances listed below. Place these measurements in the data table provided on your pH Scale Scientific Investigation Report:
- Drain Cleaner
- Hand Soap
- Blood
- Spit
- Water
- Milk
- Coffee
- Beer
- Soda
- Vomit
- Battery Acid
Data
Use the data table provided on your pH Scale Scientific Investigation Report to record your data from this scientific investigation. The data table is also shown below.
Solution |
pH |
H30+ Content |
OH- Content |
|---|---|---|---|
| Drain Cleaner | |||
| Hand Soap | |||
| Blood | |||
| Spit | |||
| Water | |||
| Milk | |||
| Coffee | |||
| Beer | |||
| Soda | |||
| Vomit | |||
| Battery Acid |
Data Analysis
In the Data Analysis section of your pH Scale Scientific Investigation Report, provide the responses to the following questions:
- When pH was raised, what type of ion concentration increased?
- When pH was lowered, what type of ion concentration increased?
- Explain the difference between a low pH and a high pH.
- Which of the substances tested in this investigation was the most basic? Which was the most acidic?
Conclusion
Using the pH Scale Scientific Investigation Report, compose three to four sentences describing an overall conclusion about the relationship between pH and concentration of hydronium and hydroxide. Base your conclusions on your data. Were your hypotheses true or false, and how do you know? Use the data and notes that you collected from your simulation experience to form your conclusion. Make sure that you include information that your gained from data analysis to support your conclusion.
Experimental Sources of Error
On your pH Scale Scientific Investigation Report, provide responses to the following questions: Are there any sources of error? If so, what are they, and what could be done to minimize error?
![]() Once you have completed the pH Scientific Investigation Report, please submit your work to the dropbox.
Once you have completed the pH Scientific Investigation Report, please submit your work to the dropbox.