


Dalton's Law
![]()
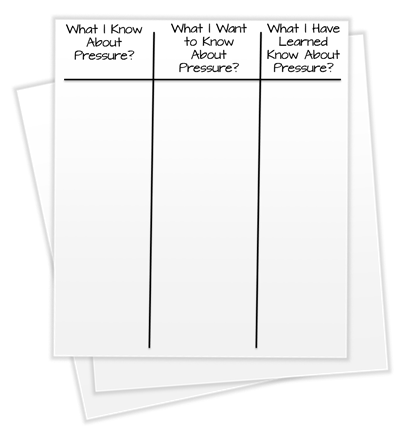 A KWL chart is used to understand the following about a topic: What an individual “Knows” about a topic; what an individual “Wants” to know about a topic; what an individual has “Learned” about a topic.
Before you learn about Dalton’s Law, create a KWL chart regarding what you know about pressure. Take a moment to create a table or chart similar to the one on this page. Your chart should have the following three headings: "What I Know About Pressure;" "What I Want to Know About Pressure;" and "What I Have Learned About Pressure." You are to complete the first two columns of the KWL chart. Save your diagram to use later in this topic.