Severe Weather

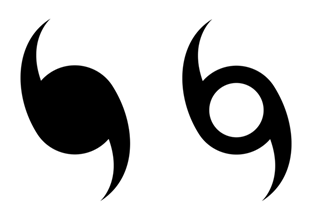
Symbols for hurricane (left) and tropical storm (right)
Hurricane Tracking
![]() Hurricanes can form in the Atlantic Ocean or Gulf of Mexico. The ability to accurately track a hurricane is vital. This very skill helps meteorologists inform governmental officials of the storm path. Government officials can then decide if they need to take measures to ensure the safety of the public. There are many small islands that may be in the path of hurricanes. These islands are not prepared for such strong storms. When a hurricane makes landfall in the United States, it can affect a very large area and some of the most populated cities in the world. In this activity, you will track several historic storms.
Hurricanes can form in the Atlantic Ocean or Gulf of Mexico. The ability to accurately track a hurricane is vital. This very skill helps meteorologists inform governmental officials of the storm path. Government officials can then decide if they need to take measures to ensure the safety of the public. There are many small islands that may be in the path of hurricanes. These islands are not prepared for such strong storms. When a hurricane makes landfall in the United States, it can affect a very large area and some of the most populated cities in the world. In this activity, you will track several historic storms.
The location of a hurricane is based on the storm’s center, or eye. The hurricane winds can extend for several hundred miles from the center. Meteorologists only track the center of the storm using latitude and longitude.
This activity is available below or in a printable version.
Procedure
When tracking a hurricane, coordinates are always given in a pair or coordinate set. You will need to find the intersection of the coordinate set on a hurricane plotting map in order to find the location of the hurricane’s eye. Follow the directions below to track each data point.
- Find the latitude of the storm by locating the horizontal line on the map that matches the given latitude. It will be necessary to estimate between lines of latitude in some coordinate sets.
- Find the longitude of the storm by locating the vertical line on the map that matches the given longitude. It will be necessary to estimate between lines of longitude in some coordinate sets.
- Find the place on the map where the two lines intersect. This is the location of the storm eye.
- At the intersection point, draw the symbol of a hurricane or tropical storm. Hurricanes have winds in excess of 74 miles per hour. Tropical storms have wind speeds of less than 74 miles per hour and greater than 39 miles per hour. If the storm has winds lower than 39 miles per hour, a dot is used to mark the storm on the map.
- On your Hurricane Tracking Map, plot the paths of Hurricanes Andrew, Katrina, and Floyd.
- Highlight each storm path with a different color of your choice.
Hurricane Data
Use the hurricane data from each table to plot the three different historic hurricanes on your Hurricane Tracking Map.
| Hurricane Irene | |||
| Date | Latitude (North) |
Longitude (West) |
Wind Speed (Knots) |
| 8/12/2005 | 28.4 |
67.1 |
65 |
| 8/13/2005 | 30.8 |
69.4 |
70 |
| 8/14/2005 | 34.0 |
70.0 |
70 |
| 8/15/2005 | 36.5 |
66.5 |
90 |
| 8/16/2005 | 36.5 |
62.0 |
105 |
| 8/17/2005 | 37.6 |
57.3 |
75 |
| 8/18/2005 | 43.3 | 48.9 | 60 |
| Hurricane Katrina | |||
| Date | Latitude (North) |
Longitude (West) |
Wind Speed (Knots) |
| 8/24/2005 | 23.4 |
75.7 |
30 |
| 8/25/2005 | 26.0 |
77.7 |
45 |
| 8/26/2005 | 25.9 |
80.3 |
70 |
| 8/27/2005 | 24.6 |
83.3 |
90 |
| 8/28/2005 | 24.8 |
85.9 |
100 |
| 8/29/2005 | 27.2 |
89.2 |
140 |
| 8/30/2005 | 32.6 |
89.1 |
50 |
| 8/31/2005 | 38.6 | 85.3 | 30 |
Data Analysis
After you have completed plotting the tracks of Hurricane Irene and Hurricane Katrina, answer the following questions in the Data Analysis section of your Hurricane Tracking Map.
- In what body of water did Hurricane Irene form? In what body of water did Hurricane Katrina form?
- Describe the water temperatures of both the Atlantic Ocean and the Gulf of Mexico on a yearly basis. Which body of water is warmer? Which body of water is cooler?
- How does the temperature of ocean water affect the formation and strength of hurricanes?
- The two hurricanes you tracked, Irene and Katrina, took place around the same time in August. What are the reasons that Katrina grew to a category five hurricane and Irene only grew to a category three hurricane?
- Hurricane Katrina reached wind speeds of 140 miles per hour on August 29, 2005. Twenty-four hours later Hurricane Katrina had wind speeds of only 50 mph. What caused this dramatic drop in wind speed?
![]()
Once you have completed the assignment, please submit your assignment to the dropbox.


