


Radiometric Dating
 Radioactive Dating
![]()
![]() Before you begin this assignment, make sure to download the Radioactive Dating Scientific Investigation Report. As you complete this scientific investigation, fill in any needed information on the report template. If you need more information about each section of the report, please visit the Developmental Module.
Before you begin this assignment, make sure to download the Radioactive Dating Scientific Investigation Report. As you complete this scientific investigation, fill in any needed information on the report template. If you need more information about each section of the report, please visit the Developmental Module.
This scientific investigation is available below or in a printable version.
Introduction
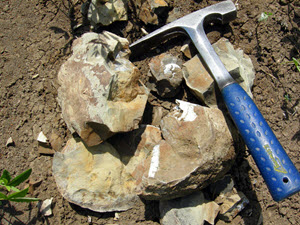
Radiometric dating is completed when scientists compare the ratio of unstable isotopes to stable isotopes in a rock or fossil specimen. Since unstable isotopes have a consistent rate of decay, the comparison allows scientists to provide an absolute age for the rock or fossil. A variety of different radioactive isotopes are used in absolute dating. Different isotopes have different rates of decay. Knowing the half-lives of several radioactive isotopes ensures that scientists can find the absolute age of even the oldest specimens.
Objectives
In this scientific investigation, you will:
- use radioactive decay rate and original daughter element ratios of carbon-14 and uranium-238 to determine ages of different objects; and
- explain how radiometric dating works and why different elements are used for dating different objects.
Hypothesis
Using the Procedure and Data Collection section below, read through the procedural information for this scientific investigation. Based on your understanding of the procedure, develop your own hypotheses which describe your expected results. Specifically, why are different elements are used for dating different objects? Record these hypotheses in the Hypothesis section of your Radioactive Dating Scientific Investigation Report.
Required Simulation
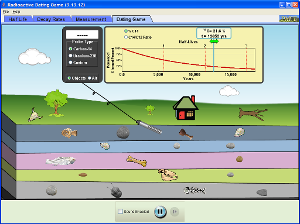
Radioactive Dating Game
(click on the image below to access simulation)
Provided by:
PhET Interactive Simulations
University of Colorado
http://phet.colorado.edu
Procedure and Data Collection
- Click on the tab labeled Half Life.
- Select the isotope Carbon-14.
- Before you begin the simulation on this tab, find the red line that marks half-life. This line indicates the half-life value for the selected isotope. During this part of the simulation, you will want to observe how many daughter isotopes appear on the left and right side of the half-life line.
- To begin the decay process, individually drag the isotopes from the bucket and drop them in the blank space to the left of the bucket. You may also click the Add 10 button to add ten isotopes at once. Record your observations in the Data section of your Radioactive Dating Scientific Investigation Report.
- Complete Step 4 for the isotope Uranium-238.
- Click on the tab labeled Decay Rates.
- To begin the decay process, increase the parent isotope by using the sliding tool found on the bucket. As the decay process it takes place, watch what happens to the graph. Make sure to run the simulation with both Carbon-14 and Uranium-238. Using the Data section of your Radioactive Dating Scientific Investigation Report, record the Half-Lives Graph for each isotope, or insert a screen shot of the completed graph.
- Click on the tab labeled Measurement.
- To begin the simulation on this tab, you will need to plant and then kill a tree. Once the tress begins decaying, drag the radioactive measuring device over the tree to notice what happens to the amount of radioactive material present as time progresses. You will want to leave the radioactive measuring device over the tree to produce an accurate graph. Using the Data section of your Radioactive Dating Scientific Investigation Report, record the completed Half-Lives Graph, or insert a screen shot of the completed graph.
- Complete Step 8 for the rock.
- Click on the tab labeled Dating Game.
- Drag the radioactive measuring device over each of the fossils in the cross-section. Estimate the age of each fossil by selecting the correct isotope. Then, slide the double green arrows on the half-life graph to the correct percentage. To check the estimated age of each fossil and rock, enter your answer in the blank space provided. In the Data section of your Radioactive Dating Scientific Investigation Report, please fill out the data table that corresponds with this part of the simulation.
Data
Using the Data section of the Radioactive Dating Scientific Investigation Report, make sure to complete all requested data on the report itself.
Data Analysis
In the Data Analysis section of your Radioactive Dating Scientific Investigation Report, provide responses to the following questions:
Half Life
- What is the daughter product for carbon-14?
- What is the daughter product for uranium-238?
Decay Rates
- What happens to the amount of parent isotopes and daughter isotopes over time?
Measurements
- Describe the graphs that were produced by the decaying of both the tree and rock.
Dating Game
- Why were different isotopes used to measure the age of different objects?
- Explain how the percentage of the element remaining helps you determine the age of the objects.
Conclusion
Using the Conclusion section of your Radioactive Dating Scientific Investigation Report, compose three to four sentences describing an overall conclusion about the relationships you examined in this scientific investigation. Were your hypotheses true or false, and how do you know? Use the data and notes that you collected from your simulation experience to form your conclusion. Make sure that you include information that you gained from data analysis to support your conclusion.
Experimental Sources of Error
On your Radioactive Dating Scientific Investigation Report, provide responses to the following questions: Are there any sources of error? If so, what are they, and what could be done to minimize error?
![]()
Once you have completed your scientific investigation, please submit your work to the dropbox.