


Abyssal Plain
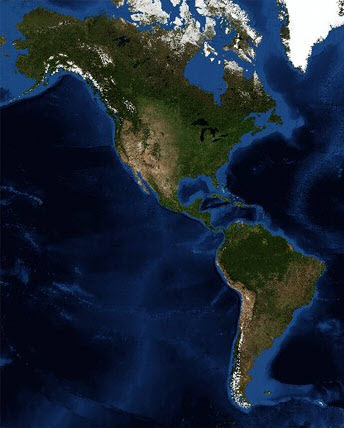
Map showing ocean depths. Darker colors indicate greater depth.
![]() What can the depth of the ocean tell you about the age of the Earth's crust that you might find there? In this activity, you are going to use data collected by Professor John Sclater of the Scripps Institution of Oceanography to find out.
What can the depth of the ocean tell you about the age of the Earth's crust that you might find there? In this activity, you are going to use data collected by Professor John Sclater of the Scripps Institution of Oceanography to find out.
In the late 1970’s, Sclater researched ocean spreading and how it was related to ocean depth. He measured the abyssal plain in different oceans. In this activity, you will use Sclater’s data to graph out the depth of the abyssal plain in different oceans to see how it compares to the age of the Earth's crust. After graphing Sclater's data, you will have a better understanding of how the depth of the abyssal plain varies by ocean and how seafloor spreading works.
For this activity you will need to graph Sclater’s data, which is found in the Sclater’s Ocean Depth vs. Crust Age Data Sheet. After downloading the data sheet, create a line graph, with the horizontal axis (x-axis) showing the age of the Earth's crust and the vertical axis (y-axis) displaying the depth of the ocean. Since your graph will contain data from different locations in each ocean, make sure to graph each location’s data in a different color so you can make comparisons between them.
Once you have completed the graph, answer the following question: What does the data tell you about the relationship between the depth of the ocean and the age of the crust? You can include your response to this question on the same file as your graph, or you can answer the question in another document and submit your answer in a separate file.
Options to create your graph include the following:
- Graph the data using a spreadsheet application and then submit the spreadsheet with the graph to the assignment’s dropbox
- Hand-draw the graph and then scan it for submission to the assignment’s dropbox
- Hand-draw the graph and then take a picture of it for submission to the assignment’s dropbox
- Use a graphics, paint, presentation, or word processing program to create the graph
![]() Once you have completed your graph and question response, please submit your work to the dropbox.
Once you have completed your graph and question response, please submit your work to the dropbox.