


Tidal Characteristics

![]() If you have ever tied a boat alongside a dock, you may have noticed that, in a few hours, the boat had moved higher or lower than before. Obviously, the vertical movement of the boat is from the tide. You can think of the periodic rise and fall of the tide in the same way that you think of water waves where the high tide is the wave crest and the low tide is the wave trough. But, what does this rise and fall look like over a period of time?
If you have ever tied a boat alongside a dock, you may have noticed that, in a few hours, the boat had moved higher or lower than before. Obviously, the vertical movement of the boat is from the tide. You can think of the periodic rise and fall of the tide in the same way that you think of water waves where the high tide is the wave crest and the low tide is the wave trough. But, what does this rise and fall look like over a period of time?
For this assignment, you will need to use the Tidal Data Charts document to obtain tidal data for one location. The document provides you with three options, but you will only need to select one. Once you have selected your location, create a graph that shows the tidal height on each day and time using the information in the chart. You will need to place your date and time on the X-axis of the graph and your tidal height on the Y-axis. The graph should resemble those that you viewed in the NOAA tidal prediction or the one given in the example at the bottom of this page. Make sure that your graph includes a title and is well -organized and clearly-labeled.
Once you have completed your graph, you should answer the following questions based on the locations graph and data:
- What type of tide did you graph?
- What is the tidal range?
Options to create your graph include the following:
- Graph the data using a spreadsheet application and then submit the spreadsheet with the graph to the assignment’s dropbox
- Hand-draw the graph and then scan it for submission to the assignment’s dropbox
- Hand-draw the graph and then take a picture of it for submission to the assignment’s dropbox
- Use a graphics, paint, presentation, or word processing program to create the graph for submission to the assignment’s dropbox
Example
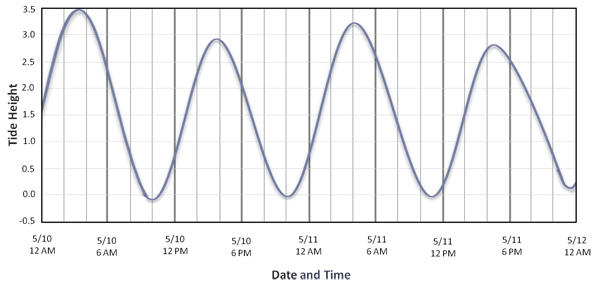
Below is a tidal graph based on tidal data for West Point, Virginia. Notice how the graph has a title and shows the date, time, and tidal height.
Tidal Graph for West Point, Virginia
This activity is available in a printable version.
![]() Once you have completed your graph and question response, please submit your work to the dropbox.
Once you have completed your graph and question response, please submit your work to the dropbox.