


Speed and Velocity
Option A: Speed and Velocity Calculations
![]() Access the Speed and Velocity Calculations and complete the problem set using the printable version. Make sure to completely answer each question and to show all of your work. Once you have completed the Speed and Velocity Calculations, please submit your work to the dropbox.
Access the Speed and Velocity Calculations and complete the problem set using the printable version. Make sure to completely answer each question and to show all of your work. Once you have completed the Speed and Velocity Calculations, please submit your work to the dropbox.
Option B: Kinematics Scientific Investigation

![]() Before you begin the scientific investigation below, make sure to download the Kinematics Scientific Investigation Report. As you complete this scientific investigation, fill in any needed information on the report template. If you need more information about each section of the report, please visit the Developmental Module.
Before you begin the scientific investigation below, make sure to download the Kinematics Scientific Investigation Report. As you complete this scientific investigation, fill in any needed information on the report template. If you need more information about each section of the report, please visit the Developmental Module.
This scientific investigation is available below or in a printable version.
Introduction
Velocity is the measure of the displacement of an object over a period of time. It is a vector quantity, meaning that it is a change in position that includes an amount and a direction. A convenient way of representing motion, including velocity, is to use position versus time graphs.
Objectives
In this scientific investigation, you will:
- explore the relationships between position, velocity, and time.
- analyze and interpret position vs. time and velocity vs. time graphs.
Hypothesis
Using the Procedure and Data Collection section below, read through the procedural information for this scientific investigation. For each of the scenarios described in the Procedure and Data Collection section, develop your own hypotheses which describe your expected results. Include sketches or graphics of what you believe a position vs. time and a velocity vs. time graph for each scenario would look like. Record your hypotheses in the Hypothesis section of your Kinematics Scientific Investigation Report.
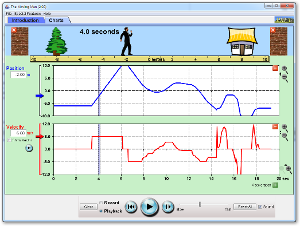
Required Simulation
Moving Man Simulation
(click on image below to run simulation)
 |
Provided by:
PhET Interactive Simulations
University of Colorado
http://phet.colorado.edu
Procedure and Data Collection
Scenario One
- Open The Moving Man simulation. Make sure that simulation is set on the Introduction tab.
- Click on the man and, over the course of ten seconds, complete the following actions:
- Move him to the right slowly.
- Stop him.
- Turn him around and move him to the left quickly.
- Click Pause.
- Click the Playback option. Observe the actions of your moving man, pausing every two seconds to enter the time, position, and velocity data into the Scenario One Data Table in the Data section of your Kinematics Scientific Investigation Report.
Scenario Two
- Click Clear and Reset All to clear The Moving Man simulation.
- Move the man directly in front of the tree and stop him. Click Pause and click Clear.
- Click on the man, and over the course of ten seconds, complete the following actions:
- Pretend that the man is sleeping under the tree, but then he wakes up.
- He runs towards the house at a constantly increasing pace.
- Stop him.
- Click Pause.
- Click the Playback option. Observe the actions of your moving man, pausing every two seconds to enter the time, position, and velocity data into the Scenario Two Data Table in the Data section of your Kinematics Scientific Investigation Report.
Data
Use the notes area and data table in the Data section of your Kinematics Scientific Investigation Report to record your data from this scientific investigation. The data table is also shown below:
Scenario One Data Table
| Time (s) | Position (m) | Velocity (m/s) |
| 0 | ||
| 2 | ||
| 4 | ||
| 6 | ||
| 8 | ||
| 10 |
Scenario Two Data Table
| Time (s) | Position (m) | Velocity (m/s) |
| 0 | ||
| 2 | ||
| 4 | ||
| 6 | ||
| 8 | ||
| 10 |
Data Analysis
In the Data Analysis section of your Kinematics Scientific Investigation Report, create two graphs for each scenario based on the data you collected in your data table. On one graph, plot the time versus position. On the second graph, plot the time versus velocity. In addition, provide responses to the following questions based on items in the simulation and the data that you collected. Make sure to completely answer each question.
- How are position and velocity related?
- How can the man have a positive position while having a negative velocity?
- How can the man have a negative position while having a positive velocity?
- How can the man have a positive position while having a positive velocity?
- How can the man have a negative position while having a negative velocity?
Conclusion
Using the Conclusion section of your Kinematics Scientific Investigation Report, compose three to four sentences describing an overall conclusion based on your data. Were your hypotheses true or false, and how do you know? Use the data and notes that you collected from your simulation experience to form your conclusion. Make sure that you include information that you gained from data analysis to support your conclusion.
Experimental Sources of Error
On your Kinematics Scientific Investigation Report, provide responses to the following questions: Are there any sources of error? If so, what are they, and what could be done to minimize error?
![]() Once you have completed the Kinematics Scientific Investigation Report, please submit your work to the dropbox.
Once you have completed the Kinematics Scientific Investigation Report, please submit your work to the dropbox.