
Physical and Climate Regions
Comparing Climate Graphs
When you begin your travels, you will visit cities with wildly different environments. It is important that you understand the variety of climates you will encounter. Otherwise, you may end up completely unprepared for your trip. One of the best ways to compare climates is to create climate graphs for the cities you will be visiting.
For this assignment, you will compare the climates of Rome, Italy and Vienna, Austria. First, you will prepare individual climate graphs for Rome and Vienna. Then, you will use those graphs and a map to analyze factors that affect the climates of the two cities.
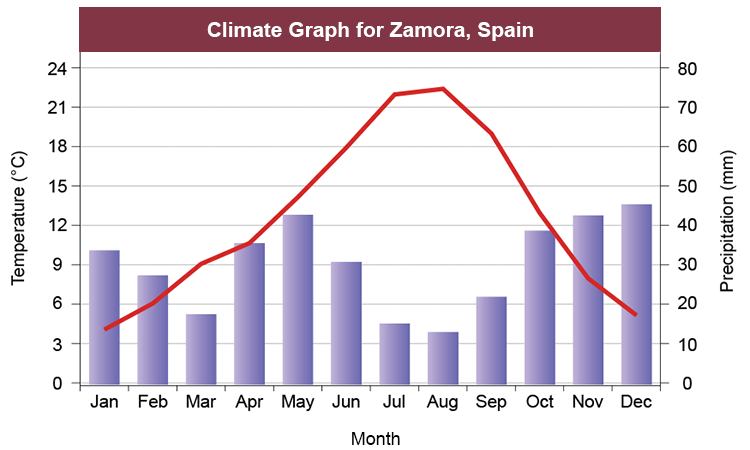
Example of a Climate Graph Which Depicts the Average Precipitation and Average Temperature: Detailed Description
Creating The Climate Graphs
Using the data provided below, create climate graphs for Rome, Italy and Vienna, Austria. First, place the months of the year on the x-axis. Then, place the average temperature and average precipitation on the y-axes. Graph the average precipitation for each month using a bar graph. Next, graph the average temperature using a line graph. You may design your own graphs or use the Climate Graph Comparison Template.
Remember to check units of measurement contained on the climate graphs. Specifically, notice that the above climate graph uses degrees Celsius and millimeters. In contrast, the below tables use degrees Fahrenheit and inches.
| Month | Temperature (°F) |
Precipitation (inches) |
|---|---|---|
| January | 45 | 3.2 |
| February | 47 | 2.7 |
| March | 51 | 2.6 |
| April | 57 | 2.6 |
| May | 64 | 2.2 |
| June | 71 | 1.6 |
| July | 76 | 0.7 |
| August | 76 | 1.0 |
| September | 70 | 2.5 |
| October | 62 | 5.0 |
| November | 53 | 4.4 |
| December | 46 | 3.0 |
| Month | Temperature (°F) |
Precipitation (inches) |
|---|---|---|
| January | 29 | 1.5 |
| February | 33 | 1.3 |
| March | 40 | 1.8 |
| April | 50 | 2.0 |
| May | 59 | 2.8 |
| June | 65 | 2.7 |
| July | 68 | 3.1 |
| August | 67 | 2.7 |
| September | 60 | 2.0 |
| October | 50 | 1.9 |
| November | 39 | 1.8 |
| December | 32 | 1.8 |
| Month | Temperature (°F) |
Precipitation (inches) |
|---|---|---|
| January | 45 | 3.2 |
| February | 47 | 2.7 |
| March | 51 | 2.6 |
| April | 57 | 2.6 |
| May | 64 | 2.2 |
| June | 71 | 1.6 |
| July | 76 | 0.7 |
| August | 76 | 1.0 |
| September | 70 | 2.5 |
| October | 62 | 5.0 |
| November | 53 | 4.4 |
| December | 46 | 3.0 |
| Month | Temperature (°F) |
Precipitation (inches) |
|---|---|---|
| January | 29 | 1.5 |
| February | 33 | 1.3 |
| March | 40 | 1.8 |
| April | 50 | 2.0 |
| May | 59 | 2.8 |
| June | 65 | 2.7 |
| July | 68 | 3.1 |
| August | 67 | 2.7 |
| September | 60 | 2.0 |
| October | 50 | 1.9 |
| November | 39 | 1.8 |
| December | 32 | 1.8 |