Line of Best Fit
![]() Using your knowledge of the line of best fit, solve each problem shown below. Follow the instructions for each question, answer all of the questions, and make sure to show all of your work.
Using your knowledge of the line of best fit, solve each problem shown below. Follow the instructions for each question, answer all of the questions, and make sure to show all of your work.
This activity is available below or in a printable document.
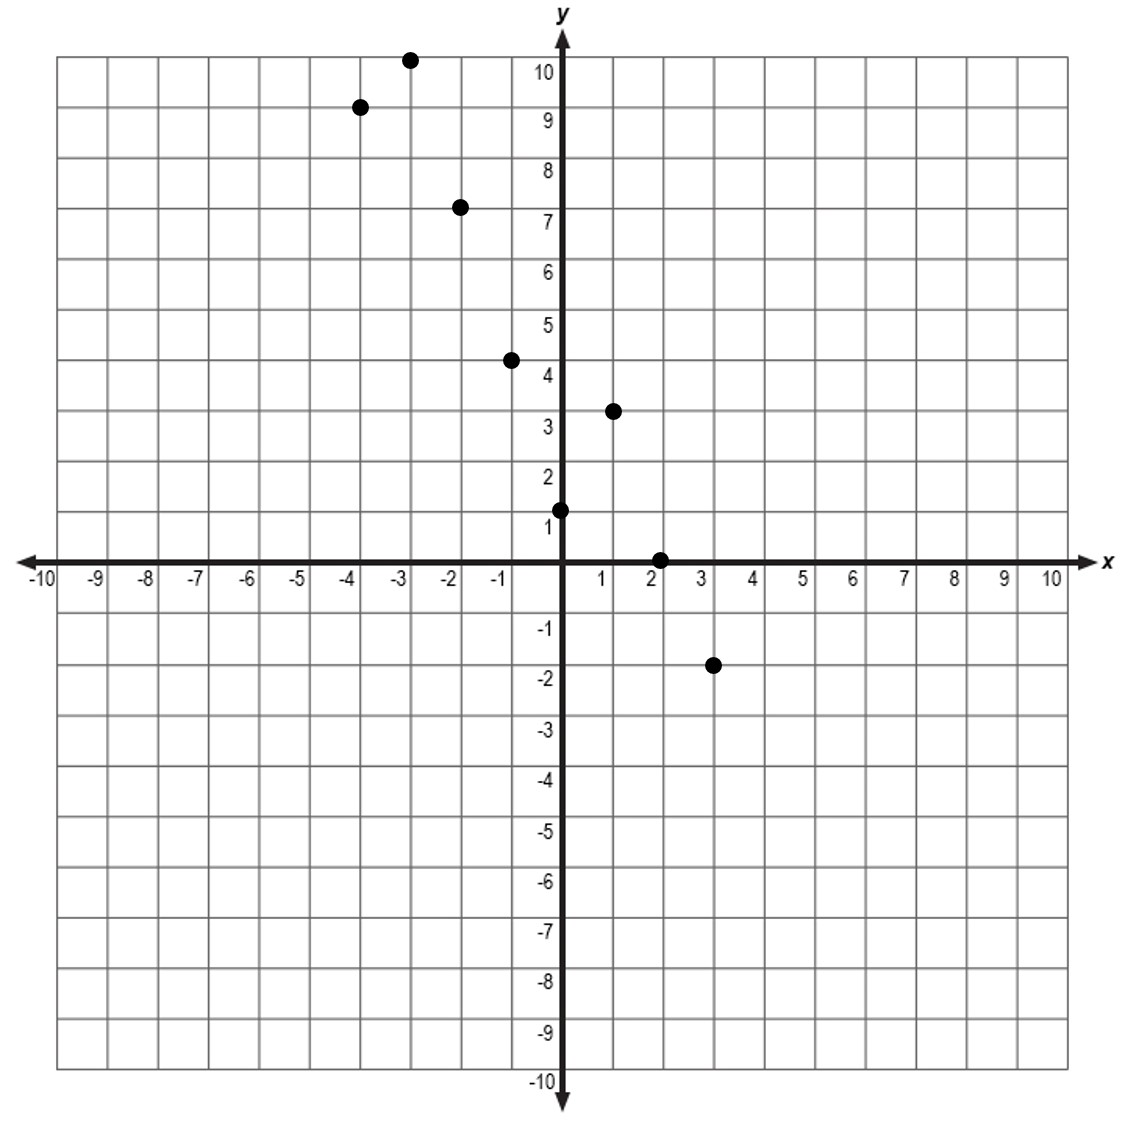
- Use the scatterplot to predict the value of y when x = 7. ________________
- The number of visitors to the homepage of an online magazine can be modeled by the equation y = 1100.74x − 1976.47, where x = 5 represents the year 2005 and y represents the total number of visitors.
Use the linear model to predict the number of visitors in the year 2034.
- For consecutive weeks, the manager of a local restaurant collected data on the number of cheese pizzas sold each week. The data is shown in the scatterplot below.
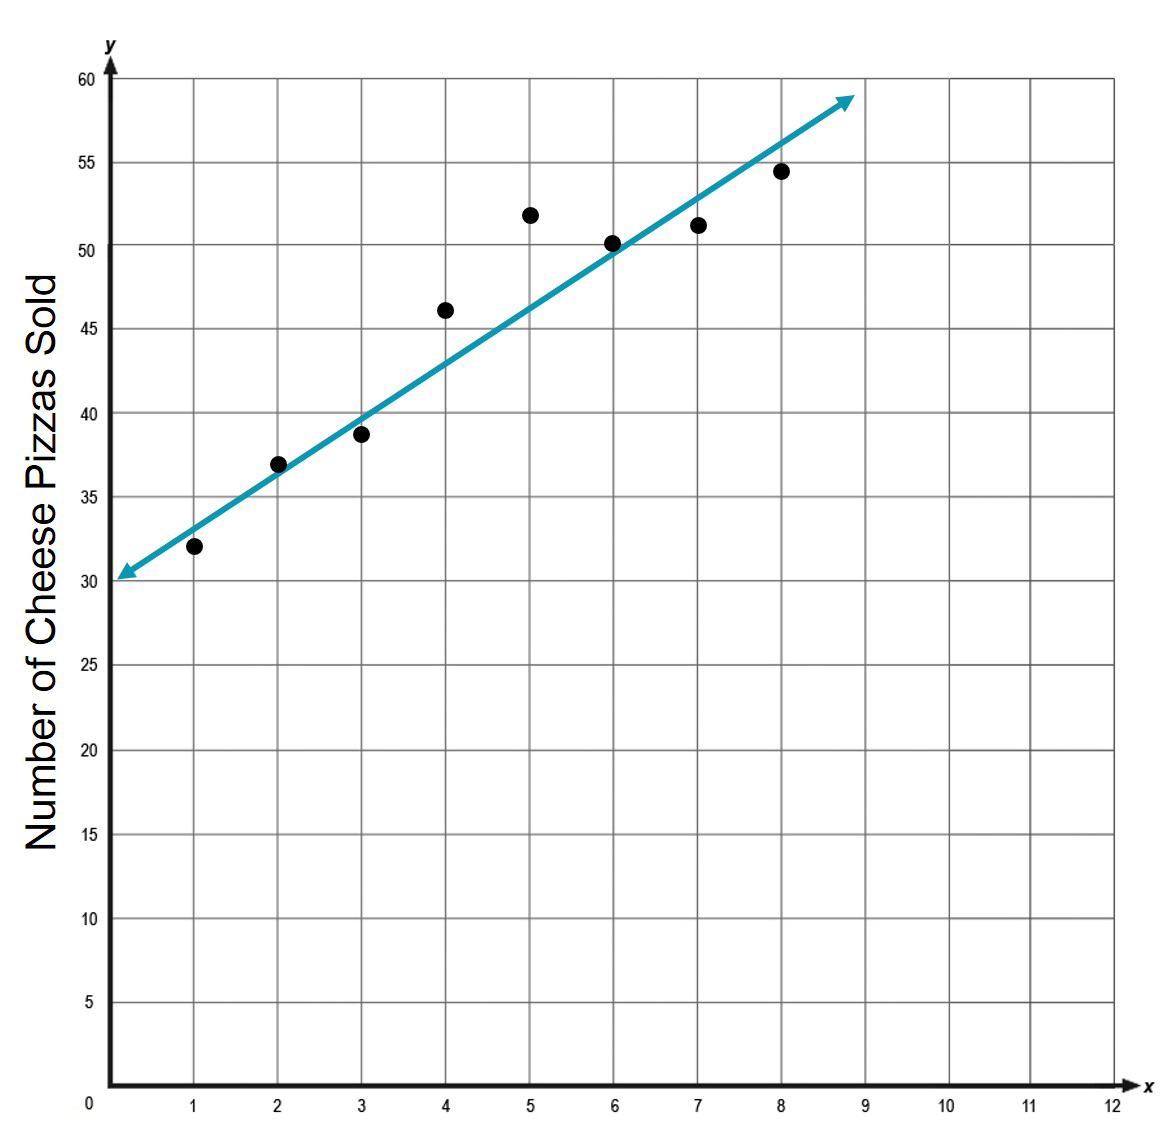
Can the given line be used to make reasonable predictions of the number of cheese pizzas that will be sold in upcoming weeks? Explain your reasoning.
- {(5, 38), (6, 34), (7, 27), (8, 21), (9, 17), (10, 14)}
- Equation of the line of best fit: _________________
- If x = 13, then the approximate value of y is _______________.
- Equation of the line of best fit: _________________
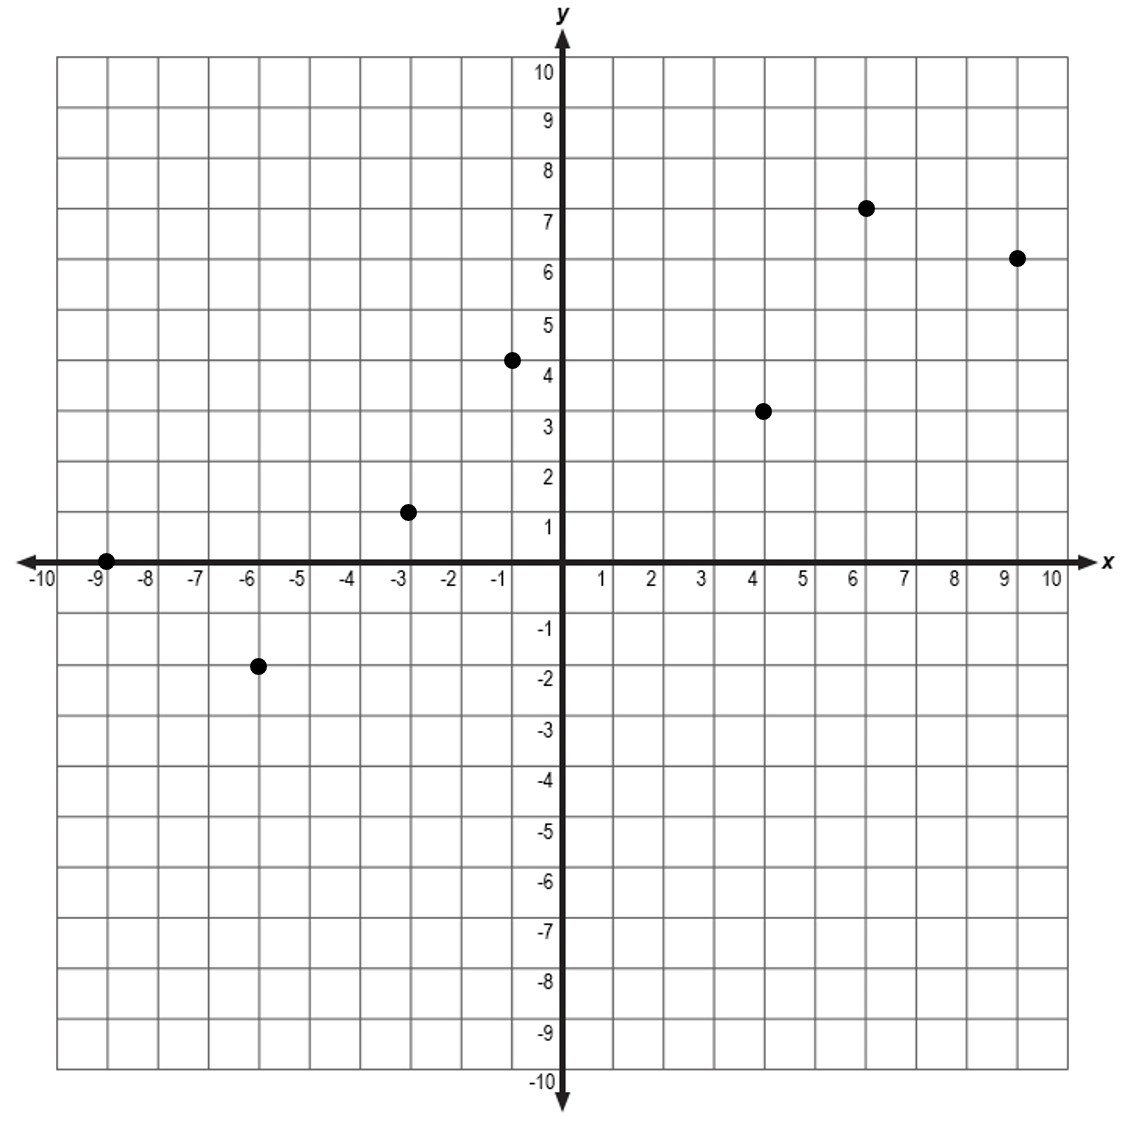
- Use the scatterplot below to answer the questions.
- Equation of the line of best fit: ________________
- If x = −15, then the approximate value of y is _______________.
- Equation of the line of best fit: ________________
- For 6 consecutive months, Deante' kept a record of the number of songs that he downloaded. The data is shown in the table below:
| Month | Number of Songs Downloaded |
| 1 | 46 |
| 2 | 39 |
| 3 | 44 |
| 4 | 50 |
| 5 | 49 |
| 6 | 53 |
- Equation of the line best fit: ________________.
- Use the equation of the line of best fit to predict the number of songs Deante' will download during Month 9. _______________
![]()
Once you have completed this assignment, please submit your work to the dropbox.