Line of Best Fit
Estimating the Line of Best Fit
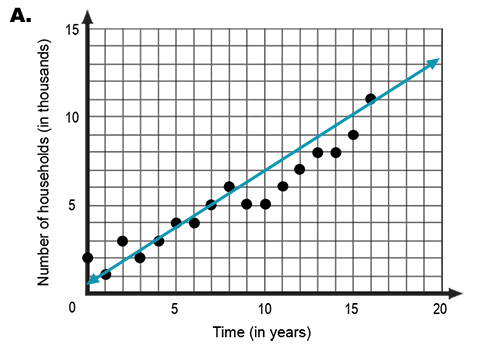
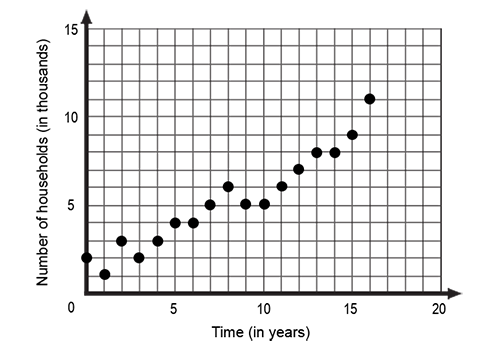
Think back to the scatterplot you analyzed in the Warm-Up. There is a positive correlation between the two variables, time (in years) and the number of households (in thousands). The line of best fit is the line that is closest to all of the data points.
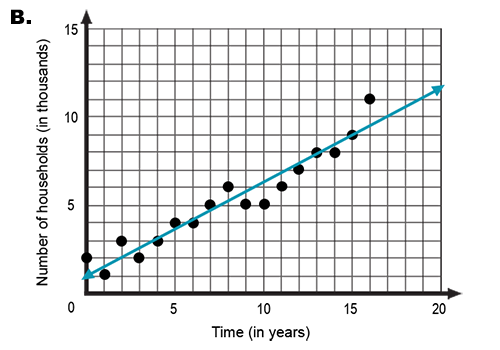
Problem: Consider the estimates of the line of best fit given below. Which line best fits the data?
Answer: Reflecting on the following questions will help you estimate the line of best fit:
- Which line is the best fit for the data? Answer Choice B. This line is closest to all of the points. The line in Answer Choice A does not appear to be steep enough.
- Which line would make reasonable predictions? Answer Choice B. This line is closest to all of the points. So, it can be used to make reasonable predictions about the number of households in the community that will not have a landline in upcoming years.
The line in Answer Choice B is the best fit for the data.
Determining the Equation of the Line of Best Fit
 The line of best fit is the line that is closest to all of the points in a data set. In earlier math courses, you learned how to estimate the line of best fit. In this interactivity, you will learn how to use the graphing calculator to determine the equation of the line of best fit. Click the player button to begin.
View a printable version of this interactivity.
Using Mathematical Models of Linear Functions to Make Predictions
 The line of best fit is a linear model, a linear function that represents a data set. It can be used to solve practical problems. In this interactivity, you will learn how to use the equation of the line of best fit to make predictions. Click the player button to begin.
View a printable version of this interactivity.
Using a Scatterplot to Determine the Equation of the Line of Best Fit
In earlier math courses, you learned how to estimate the line of best fit and to use the estimation to make predictions. Using the graphing calculator to determine the equation of the line of best fit, allows you to make predictions that are more accurate than predictions made using an estimate of the line of best fit.
Problem: Consider the scatterplot presented in the Warm-Up. Predict the number of households that will not maintain a landline, in the year 2028 (x = 28 represents the year 2028).
Step 1: Determine the coordinates of each point in the scatterplot.
Step 2: Enter the data into the calculator to generate the equation of the line of best fit.
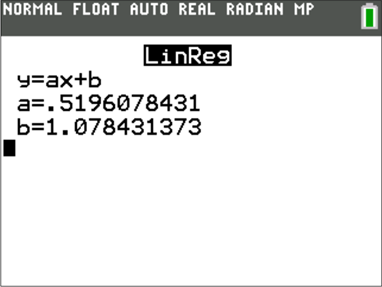
It is important to mention that the rounding that occurs during the in-between steps to solving a problem may cause your final answer to be less accurate. This is why it is important to round to a value that maintains a reasonable number of significant digits. For the problems that you solve in this topic, rounding to the hundredths place is acceptable.
The equation of the line of best fit for the data is y = 0.52x + 1.07.
Step 3: Use the equation to predict the number of households in the community that will not maintain a landline in the year 2028.

Line of Best Fit Review
![]()
 Now that you have explored the line of best fit, it is time to test your knowledge. This interactivity will help you review the information covered throughout this topic. Click the player button to get started.
![]() Did you answer the content review questions incorrectly? Do you want more instruction or extra practice? If so, view the video Determining the Equations of Lines and Curves of Best Fit from eMediaVASM.
Did you answer the content review questions incorrectly? Do you want more instruction or extra practice? If so, view the video Determining the Equations of Lines and Curves of Best Fit from eMediaVASM.