


Plate Tectonics
Plate Tectonics Scientific Investigation
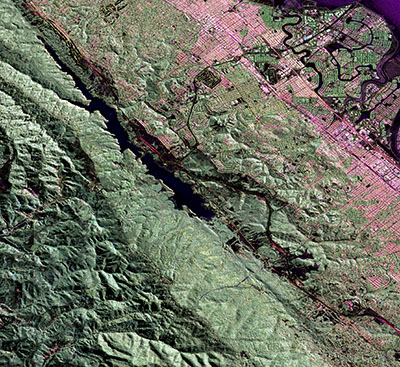
Courtesy of NASA Jet Propulsions Laboratory
A false-color radar image of the San Andreas Fault in California
![]() Before you begin this assignment, make sure to download the Plate Tectonics Scientific Investigation Report. As you complete this scientific investigation, fill in any needed information on the report template. If you need more information about each section of the report, please visit the Developmental Module.
Before you begin this assignment, make sure to download the Plate Tectonics Scientific Investigation Report. As you complete this scientific investigation, fill in any needed information on the report template. If you need more information about each section of the report, please visit the Developmental Module.
This scientific investigation is available below or in a printable version.
Introduction
Oceanic crust and continental crust have several different characteristics. These characteristics impact the behavior of their plates. The interactions of Earth’s lithospheric plates have created tall mountains, cavernous trenches, explosive volcanoes, and rattling earthquakes.
Objectives
In this scientific investigation, you will:
- compare the difference between oceanic crust and continental crust;
- examine the three different types of plate boundaries; and
- explore the outcomes of plate interactions.
Hypothesis
Using the Procedure and Data Collection section below, read through the procedural information for this scientific investigation. Based on your understanding of the procedure, develop your own hypotheses which describe your expected results. Specifically, how do you think the temperature, thickness, and density of continental crust and oceanic crust will compare? Also, how do the different types of crust behave along the three different types of plate boundaries? Record these hypotheses in the Hypothesis section of your Plate Tectonics Scientific Investigation Report.
Required Simulation
Plate Tectonics Simulation
(click on image below to access simulation)
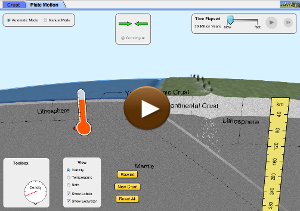
Provided by: PhET Interactive Simulations
University of Colorado
http://phet.colorado.edu
Procedure and Data Collection
Part 1: Explore the Simulation
Take a few minutes to explore the simulations on both of the tabs. Take note of the different variables that you can alter in the simulations. Also, make sure to access the tools that you have available to you in the simulation's "Toolbox." Once you are done exploring the simulation, make sure to click on the Crust tab and click Reset All.
Part 2: Crust
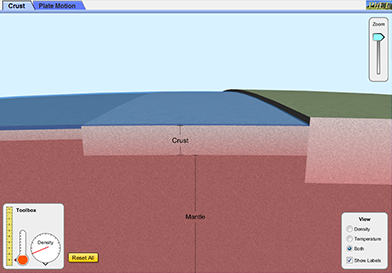 Complete your experimental set-up by accessing the View area and clicking the option to view Both and the checkbox to Show Labels.
- In the Data section of your Plate Tectonics Scientific Investigation Report, record any observations about the thickness and relation to the mantle layer of the three different types of crust (Oceanic Crust, My Crust, and Continental Crust).
- You will now need to use the "Toolbox" to compare the three different types of crust. First, "grab" the metric ruler with your cursor. Use it to measure the thickness of the Oceanic Crust. Record your measurement in the Crust Attributes Data Table in the Data section of your Plate Tectonics Scientific Investigation Report. Repeat this for the My Crust and Continental Crust areas of the simulation. Once you have measured the thickness of all three types of crust, return the ruler to the Toolbox.
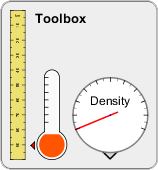 Now, "grab" the thermometer with your cursor. Slowly move it across the three types of crusts from left to right. Use it to compare the temperature of the Oceanic Crust with the other types of crust. Record your observations using the checkboxes in the Crust Attributes Data Table in the Data section of your Plate Tectonics Scientific Investigation Report. Once you have observed the temperatures of all three types of crust, return the thermometer to the Toolbox.
- Next, "grab" the density meter with your cursor. Slowly move it across the three types of crusts from left to right. Use it to compare the density of the Oceanic Crust with the other types of crust. Record your observations using the checkboxes in the Crust Attributes Data Table in the Data section of your Plate Tectonics Scientific Investigation Report. Once you have observed the densities of all three types of crust, return the density meter to the Toolbox.
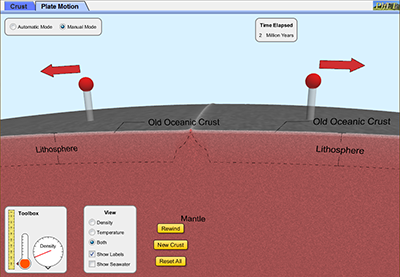
Part 3: Plate Motion
- Click on the Plate Motion tab.
- Complete your experimental set-up by accessing the View area and clicking the option to view Both and the checkbox to Show Labels. Make sure that the simulation is set to Manual Mode.
- In the lower right corner of the simulation, there are three different types of crust. Drag and drop a piece of Continental Crust on the left side of the screen. Drag and drop a piece of Old Oceanic Crust on the right side of the screen.
- Use your cursor to drag the red handled joystick in the direction of the green arrow on the screen until the Time Elapsed area reads 9 Million Years. Release the joystick. In the Data section of your Plate Tectonics Scientific Investigation Report, make a sketch of what is occurring, name the type of boundary, and write a brief description of what is taking place at the boundary.
- Click New Crust to clear the simulation.
- Drag and drop a piece of Old Oceanic Crust on the left side of the screen. Drag and drop a piece of Old Oceanic Crust on the right side of the screen.
- Use your cursor to drag the one of the red handled joysticks towards you in the direction of the blue arrow until the Time Elapsed area reads 9 Million Years. Release the joystick. In the Data section of your Plate Tectonics Scientific Investigation Report, make a sketch of what is occurring, name the type of boundary, and write a brief description of what is taking place at the boundary.
- Click New Crust to clear the simulation.
- Drag and drop a piece of Continental Crust on the left side of the screen. Drag and drop a piece of Continental Crust on the right side of the screen.
- Use your cursor to drag the one of the red handled joysticks towards you in the direction of the blue arrow until the Time Elapsed area reads 9 Million Years. Release the joystick. In the Data section of your Plate Tectonics Scientific Investigation Report, make a sketch of what is occurring, name the type of boundary, and write a brief description of what is taking place at the boundary.
- Click New Crust to clear the simulation.
 Drag and drop a piece of Old Oceanic Crust on the left side of the screen. Drag and drop a piece of Old Oceanic Crust on the right side of the screen.
- Use your cursor to drag the one of the red handled joysticks in the direction of the red arrow until the Time Elapsed area reads 9 Million Years. Release the joystick. In the Data section of your Plate Tectonics Scientific Investigation Report, make a sketch of what is occurring, name the type of boundary, and write a brief description of what is taking place at the boundary.
Data
Using the Data section of the Plate Tectonics Scientific Investigation Report, make sure to complete all requested data on the report itself.
Data Analysis
In the Data Analysis section of your Plate Tectonics Scientific Investigation Report, provide responses to the following questions:
- In Part 2: Crust, you examined three different types of crust. One of the types of crust was labeled "My Crust" and exhibited different properties from the Continental Crust and Oceanic Crust provided by the simulation; however, it was under the water. What do you think is the difference between the My Crust and the Oceanic Crust?
- In Part 2: Crust, why does the Continental Crust sit higher than then Oceanic Crust?
- In Part 3: Plate Motion, when you have one piece of Oceanic Crust and one piece of Continental Crust provided by the simulation, why are you not able to create a divergent boundary? Why is only one type of arrow available?
- In Part 3: Plate Motion, what causes the oceanic crust to subduct under the continental crust?
- In Part 3: Plate Motion, when you have two pieces of Oceanic Crust provided by the simulation and you are pushing the joystick in the direction of the red arrow, what is causing the new crust? What is happening to the old crust?
Conclusion
Using the Conclusion section of your Plate Tectonics Scientific Investigation Report, compose three to four sentences describing an overall conclusion about the relationships between the tectonic plates that you examined in this scientific investigation. Were your hypotheses true or false, and how do you know? Use the data and notes that you collected from your simulation experience to form your conclusion. Make sure that you include information that you gained from data analysis to support your conclusion.
Experimental Sources of Error
On your Plate Tectonics Scientific Investigation Report, provide responses to the following questions: Are there any sources of error? If so, what are they, and what could be done to minimize error?
![]() Once you have completed the Plate Tectonics Scientific Investigation Report, please submit your work to the dropbox.
Once you have completed the Plate Tectonics Scientific Investigation Report, please submit your work to the dropbox.