Origin and Classification of Marine Sediment
![]()
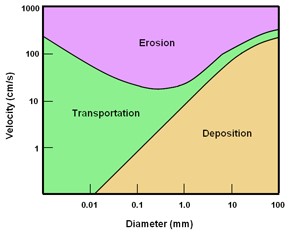
 Now that you have learned the various ways in which geologists classify sediments, you are going to use the Hjulstrom diagram (shown at right) to determine what would happen to different sized particles subjected to different water velocities. Download the Hjulstrom Diagram Data sheet and complete the data table provided. Once you have completed the data table, use a Wentworth Scale to answer the Analysis Questions shown on the data sheet.
![]() Once you have completed your assignment, please submit your work to the dropbox.
Once you have completed your assignment, please submit your work to the dropbox.


